Property markets surged in October for the typical mid-spring peak in activity.
Executive summary
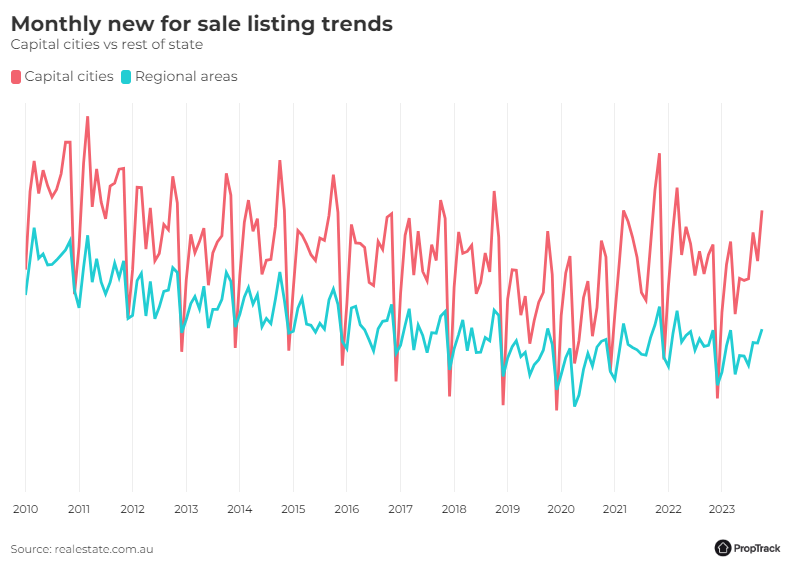
The number of homes newly listed for sale jumped strongly around the country in October for the typical seasonal peak of the spring selling season. New listings nationally on realestate.com.au jumped 17% month-on-month in October to be 15.7% higher than a year earlier.
Both Sydney and Melbourne saw much busier mid-spring activity than last year. New listings in Sydney were 32.5% higher than at the same time last year, and up 31.7% in Melbourne. That strong growth reflects, in part, how quiet spring was for both cities last year. Activity this October was closer to what has been typical for mid-spring over the past decade, with Melbourne recording a little more activity than average, and Sydney a little less.
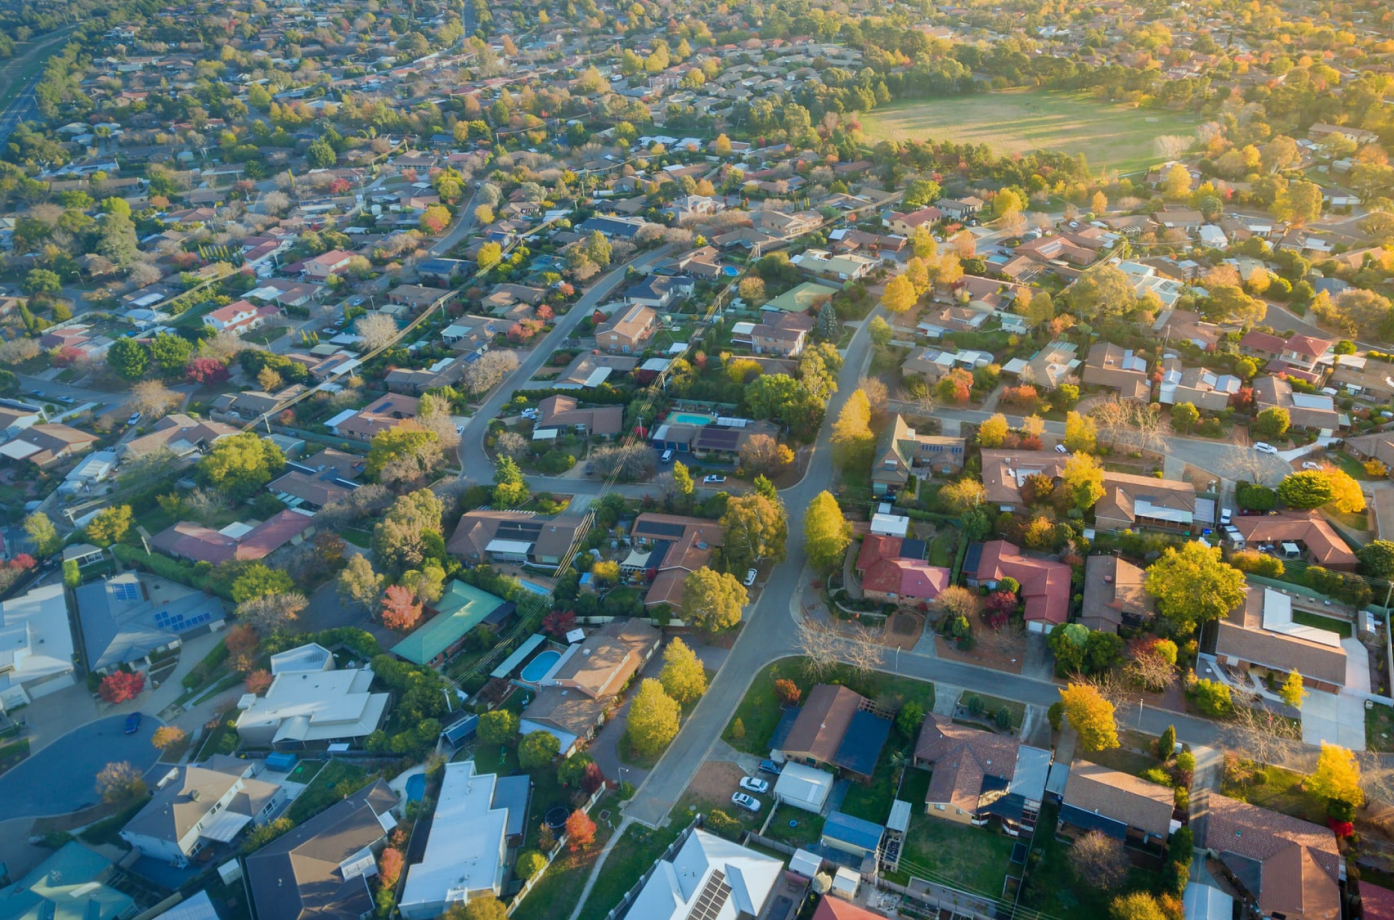
The number of new listings on realestate.com.au were 15.7% higher in October than a year earlier. Picture: Getty
Most other capitals also saw a busier October this year than last. Notably, Brisbane saw 3.4% more new listings when compared to a year ago. While a modest increase, it is the first time since August last year that Brisbane recorded positive year-on-year growth in new listings. Among the capitals, only Perth bucked the trend, recording 7.3% fewer new listings this year than last.
Regional areas also saw activity ramp up for mid-spring. Unlike the combined capital cities, November, not October, is typically the busiest month of the spring selling season regionally. As a result, the month-on-month pick up was more modest (9.4% month-on-month) in regional markets. That said, activity did exceed the pace set last year, with 11.1% more new listings than at the same a year ago.
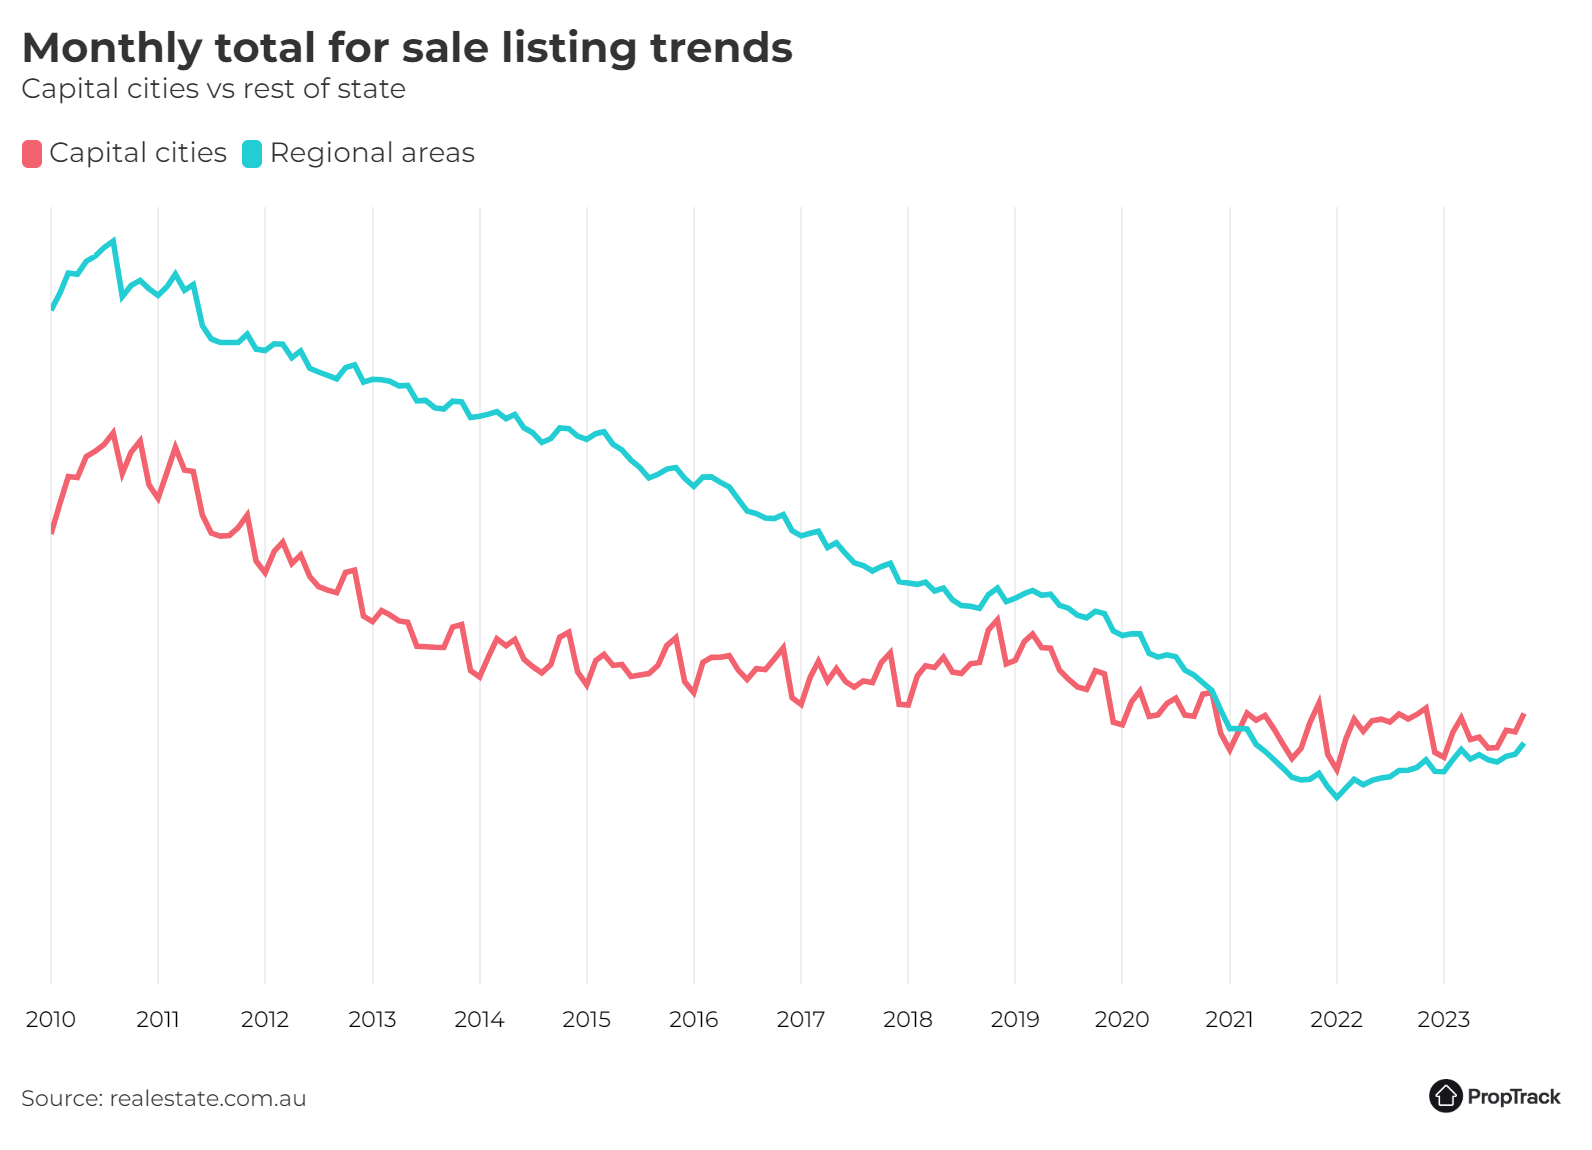
Buyers around the country enjoyed more choice in October off the back of the busier month of new listings hitting the market. For buyers in Melbourne, Sydney, Canberra, and Hobart, choice is particularly strong, with all four cities having more total properties available for sale in October than has been typical in the past decade. For buyers in Brisbane, Adelaide and Perth, choice remains much more restricted as it has been for some time.
Choice improved regionally as well, with 4.8% more total properties listed for sale in October than September, and 11.3% more than a year earlier. The increase is particularly notable in regional Victoria, where the total number of properties listed for sale is now higher than it was pre-pandemic. The number of properties listed for sale has more than doubled compared to mid-2021, when choice in regional Victoria was very limited.
Where to from here?
This year’s spring selling season has been stronger than last year’s so far, particularly in Sydney and Melbourne. That reflects improved selling conditions, more certainty about interest rates, and the fact that prices are growing across much of the country this year, compared to declines last year. These factors have supported vendor confidence.
Of particular note, property prices have climbed every month in 2023, and continued to do so in October. That means prices nationally have completely recovered last year’s falls.
The RBA increased interest rates a further 25 basis points in November after four months without a change. While markets are pricing in only a modest chance of further increases, they remain a possibility. Any further increase in rates could negatively affect buyer and seller sentiment.
Tight rental markets, strong population growth, and growing wages will continue to support fundamental demand for property.
Sydney’s property market saw a much busier mid-spring than last year.
Sydney’s property market saw activity pick up for the typical mid-spring peak in activity, with new listings jumping 16.9% month-on-month in October. That jump, combined with last year’s slow spring, meant activity this October was much busier than at the same time last year. The number of new listings was up 32.5% year-on-year.
While a substantially busier month than at the same time last year, this October was marginally slower than is typical for mid-spring in Sydney.
The good news for buyers across Sydney is that the busy month of new properties hitting the market lifted choice. The total number of properties listed for sale was up 6% compared to September and was 6.3% higher than a year ago. Looking over a longer horizon, choice for buyers is quite healthy, with around 14% more total listings in October than has been typical on average over the past decade.
It was a similar story regionally, though the jump in activity for mid-spring was more subdued than in Sydney, as is usually the case. Regional NSW saw 7.1% more new listings month-on-month in October, representing 20.8% more new listings than at the same time last year.
That helped lift choice for buyers regionally, continuing the trend of improving choice after the pandemic. Compared to a year ago, the total number of properties available for sale in regional NSW was up 22.3% in October.
Victoria
Melbourne’s property market had its busiest month since early 2022 as activity surged for the typical peak of the spring selling season.
Activity in Melbourne’s property market surged for a busier-than-typical October after a quieter, public holiday-affected September. New listings picked up 30.8% compared to September – a solid month-on-month jump.
While October is typically the busiest month for Melbourne’s market, this October was busier than usual. Compared to last year’s quiet spring, that meant new listings were up a brisk 31.7% year-on-year. It’s worth noting, the Melbourne cup long weekend partly straddled October in 2022, which would have also weighed on activity last year.
The surge of new properties hitting the market meant buyers enjoyed an increase in choice in October. The total number of properties listed for sale in October was up 9.1% compared to September. That brings the total number of properties listed for sale around 20% above its average over the past decade.
Property markets in regional Victoria saw a similarly busy mid-spring. New listings regionally were up 26.6% month-on-month to be 24.4% higher than a year ago.
That helped lift the total number of properties listed for sale in October above where it stood pre-pandemic for the first time. That represents a remarkable improvement in choice – with twice as many properties now listed for sale as was the case in mid-2021 when choice for buyers regionally reached a low.
Queensland
Brisbane’s property market warmed up for its typical mid-spring peak, recording more new listings than a year ago for the first time in 2023.
Activity in Brisbane’s property market lifted strongly in October, up 13.7% month-on-month, for what is usually the city’s busiest month of the year. That increase, coupled with a slower spring last year, helped boost activity higher than a year earlier for the first time since August last year. New listings in October were up 3.4% year-on-year.
In good news for buyers, the busy month of new properties hitting the market helped improve choice, with 5.4% more total listings in October than September. While that will come as some relief, choice remains very restricted, down nearly 40% compared to what has been typical for the past decade.
Activity also picked up a little in regional Queensland in October, though continued to lag the pace set last year as it has throughout 2023. The number of new listings across regional Queensland in October was 2.8% lower year-on-year.
South Australia
Adelaide’s property market saw a surge in activity for mid-spring, which helped improve choice for buyers.
Activity in Adelaide’s property market surged in October after a quieter September, with 23.4% more new listings hitting the market. That meant this year saw a busier mid-spring than last year, with 9.9% more new listings than a year earlier.
The surge in new properties hitting the market helped lift choice for buyers substantially. The total number of properties listed for sale in October was 9.6% higher than in September, representing a modest improvement compared to mid-spring last year (up 1.6% year-on-year). Nonetheless, choice for buyers remains restricted, with total listings around a third lower than the average over the past decade.
In contrast, regional markets saw activity cool in October, with new listings down 6.5% month-on-month. Even so, activity remained busier than last year, with 8.7% more new listings hitting the market this October than last.
Western Australia
Activity in Perth’s property market jumped strongly in October for what is usually the busiest month of the year.
Mid-spring saw activity surge in Perth’s property market, with 20.3% more new listings than in September. Even so, activity lagged the pace seen last year, as has been the case throughout 2023 across Perth.
With limited new supply and strong demand, properties hitting the market have been snapped up quickly. The typical time to sell a home across Perth is sitting around its lowest level in at least five years and is around half what it was pre-pandemic.
That means that total choice for buyers across Perth remains extremely restricted. While the total number of properties listed for sale picked up in October, the monthly increase was not enough to unwind the decline in September. As a result, the total number of properties available for sale is just 1.3% above its lowest ever level and is nearly 40% lower than what has been typical over the past decade.
Regional WA saw more properties hitting the market in mid-spring than last year, with new listings up a modest 1.5% year-on-year. However, like Perth, strong buyer demand has meant properties are selling quicker. As a result, the total number of homes listed for sale in October was well down compared to the same time last year (-9.9% year-on-year).
Tasmania
Buyers in Hobart saw choice improve, with the total number of properties for sale across the city now above the decade average.
Buyers in Hobart enjoyed further improvements in choice in October, as has been the case throughout 2023. Hobart’s property market saw more new listings hitting the market in October than at the same time a year ago, with new listings up 7% year-on-year.
That helped lift the total number of properties listed for sale 22.6% higher than a year ago, meaning the total number of properties available for sale is up more than two and a half times compared to its limited level in 2021. The total number of properties available for sale is now above the average over the prior decade for Hobart.
The story was similar in regional Tasmania, with 10.8% more new listings hitting the market this October than last year. Like Hobart, choice for buyers has improved substantially, with the total number of properties listed for sale in October up 34% compared to a year ago.
Northern Territory
Darwin’s property market saw activity increase modestly in October, bringing it in line with last year’s pace.
Activity picked up modestly in Darwin’s housing market for the middle of spring, with 4.5% more new listings hitting the market than in September. That helped bring listings activity in line with where it stood at the same time last year, representing the first time this year that activity hasn’t lagged the pace set in 2022.
The good news for buyers is that choice has continued to improve, with the total number of properties listed for sale across Darwin in October up 7.9% compared to the same time last year, and up 2.8% compared to a month earlier.
New listings fell in the small and often volatile regional NT market compared to September and were down relative to a year ago.
Australian Capital Territory
Activity in Canberra’s property market surged for the middle of spring, with the busiest October for new listings on record.
New listings in Canberra surged in October for mid-spring, with 32.4% more new listings than in September. That increase meant Canberra recorded its busiest ever October, and second busiest month ever (behind only November 2021).
The busy month reflected a much faster pace of activity than at the same time last year, with new listings up 24.5% year-on-year.
Choice for buyers in Canberra surged on the back of the wave of new properties hitting the market, with the total number of properties available for sale in October 11% higher than in September, and 23.6% higher than a year ago.
Methodology
The ‘PropTrack Listings Report’ details monthly changes in the number of properties listed for sale on realestate.com.au. The listings are split into ‘new’ and ‘total’ listings.
New listings consist of properties that were newly listed for sale on realestate.com.au within the reported month.
Total listings is the total supply of properties for sale in the reported month. It consists of all listings which were for sale during that month (including new listings) irrespective of the date they first appeared on site.
The geographical areas described in this report are based on the Greater Capital City Statistical Area (GCCSA) as defined by the Australian Bureau of Statistics.
Disclaimer: PropTrack Listings Report is summary information only. realestate.com.au Pty Limited [REA] makes no representation whatsoever about PropTrack Listings Report’s completeness or accuracy. REA is under no obligation to update or correct any of the PropTrack Listings Report data or to continue to make the PropTrack Listings Report available. REA recommends that any users of the PropTrack Listings Report exercise their own skill and care with respect to their use of the PropTrack Listings Report and that users carefully evaluate the accuracy, currency, completeness and relevance of the PropTrack Listings Report for their purposes. REA expressly bears no responsibility, and accepts no liability, whatsoever for any reliance placed by you or others on the PropTrack Listings Report, or from any use of the PropTrack Listings Report by you or others. If you wish to cite or refer to this report (or any findings or data contained in it) in any publication, please refer to the report as the ‘PropTrack Listings Report – October 2023′.