Property markets around the country ramped up in August, led by Sydney and Melbourne, which both recorded their busiest end to winter in more than a decade.
Executive summary
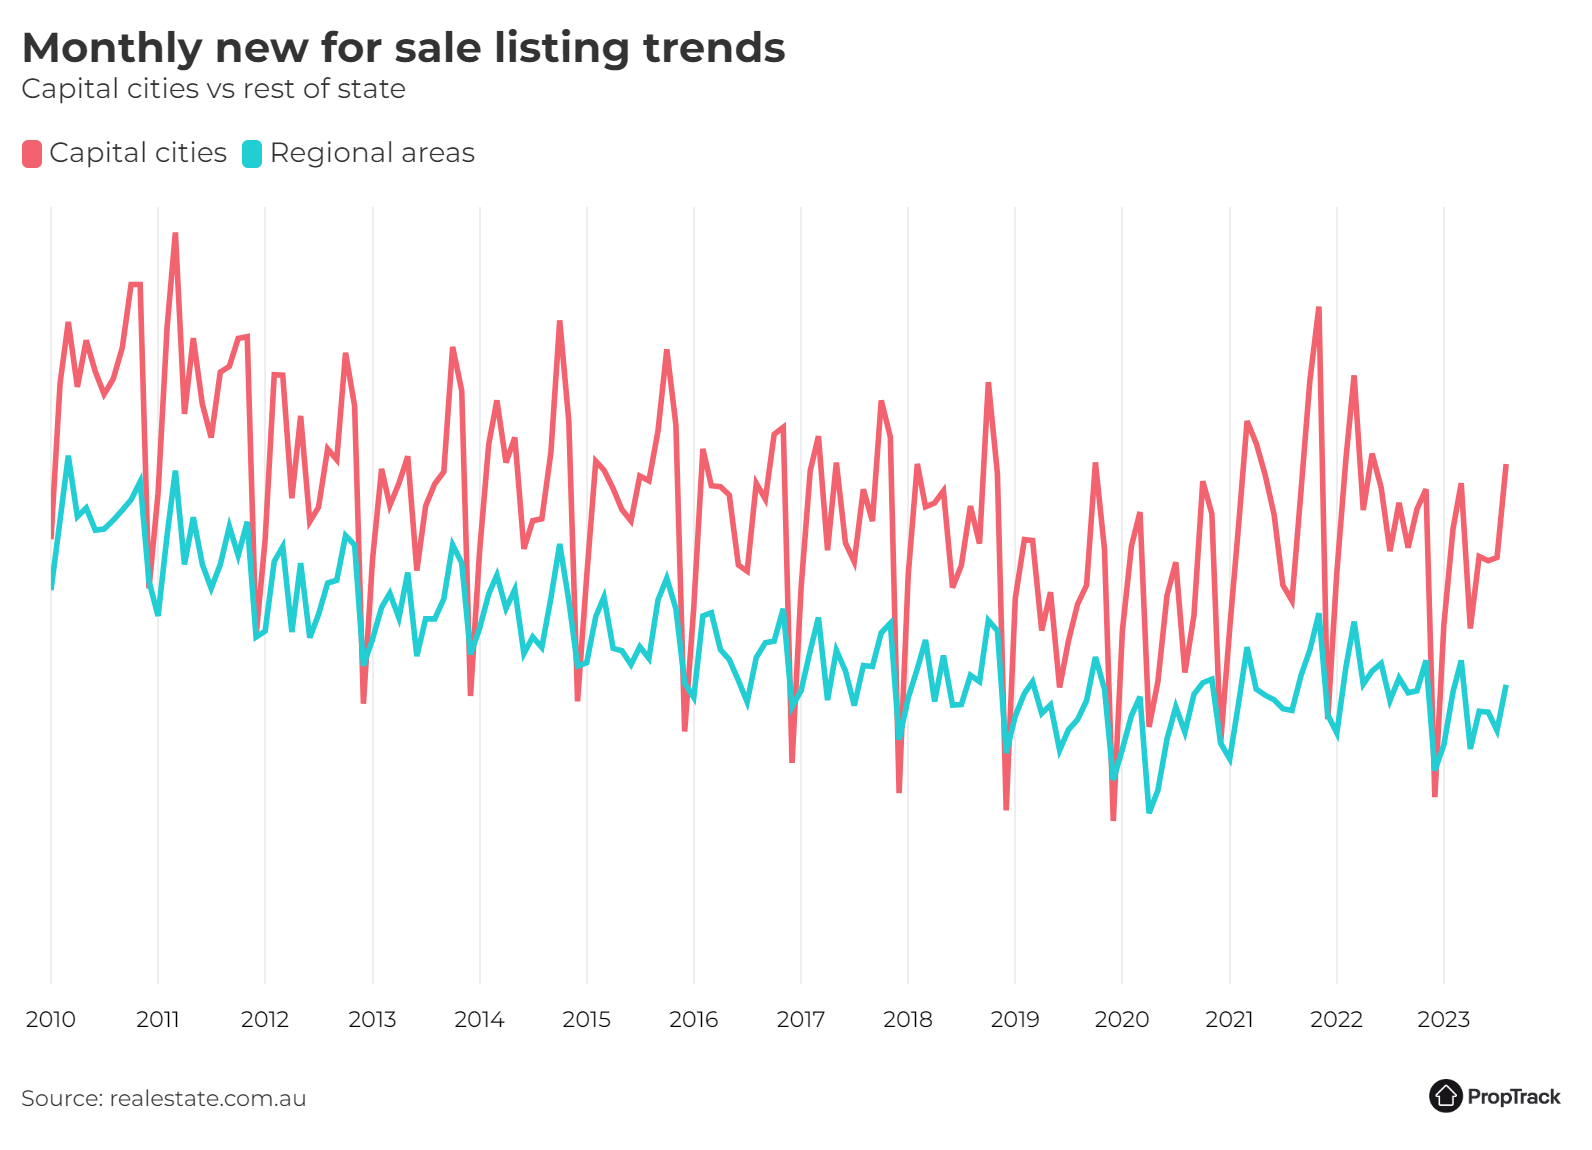
Property markets had a busier-than-usual end to winter, with more new properties hitting the market during August than a year earlier - the first time new listings nationally have increased year-on-year since August 2022.
Compared to July, the number of new listings nationally on realestate.com.au increased 20.5% month-on-month as activity picked up ahead of spring. That helped lift the number of new listings in August to be 4.1% higher compared to the same time a year ago.
Property markets had a busier-than-usual end to winter with more properties hitting the market in August. Picture: Getty
Sydney and Melbourne led the busier month. Both cities recorded their busiest end to winter in more than a decade and both saw a strong increase in new listings compared to a year ago (Sydney +18.4% year-on-year; Melbourne +20.8% year-on-year). That lift in the largest capitals meant new listings across the combined capital cities were higher than a year ago for the first time since August last year. Canberra also recorded a busy end to winter.
Other capitals also saw a strong pick up in new listings compared to July as activity ramped up for the spring selling season. However, unlike Sydney and Melbourne, most still lagged the pace set in August last year. Brisbane (-10.4% year-on-year), Perth (-8.6% year-on-year) and Darwin (-5.4% year-on-year) saw the largest declines compared to a year ago.
Regional areas also saw activity ramp up ahead of spring, but unlike the combined capital cities, they continued to record a slower pace of activity compared to last year (down 2.2% year-on-year).
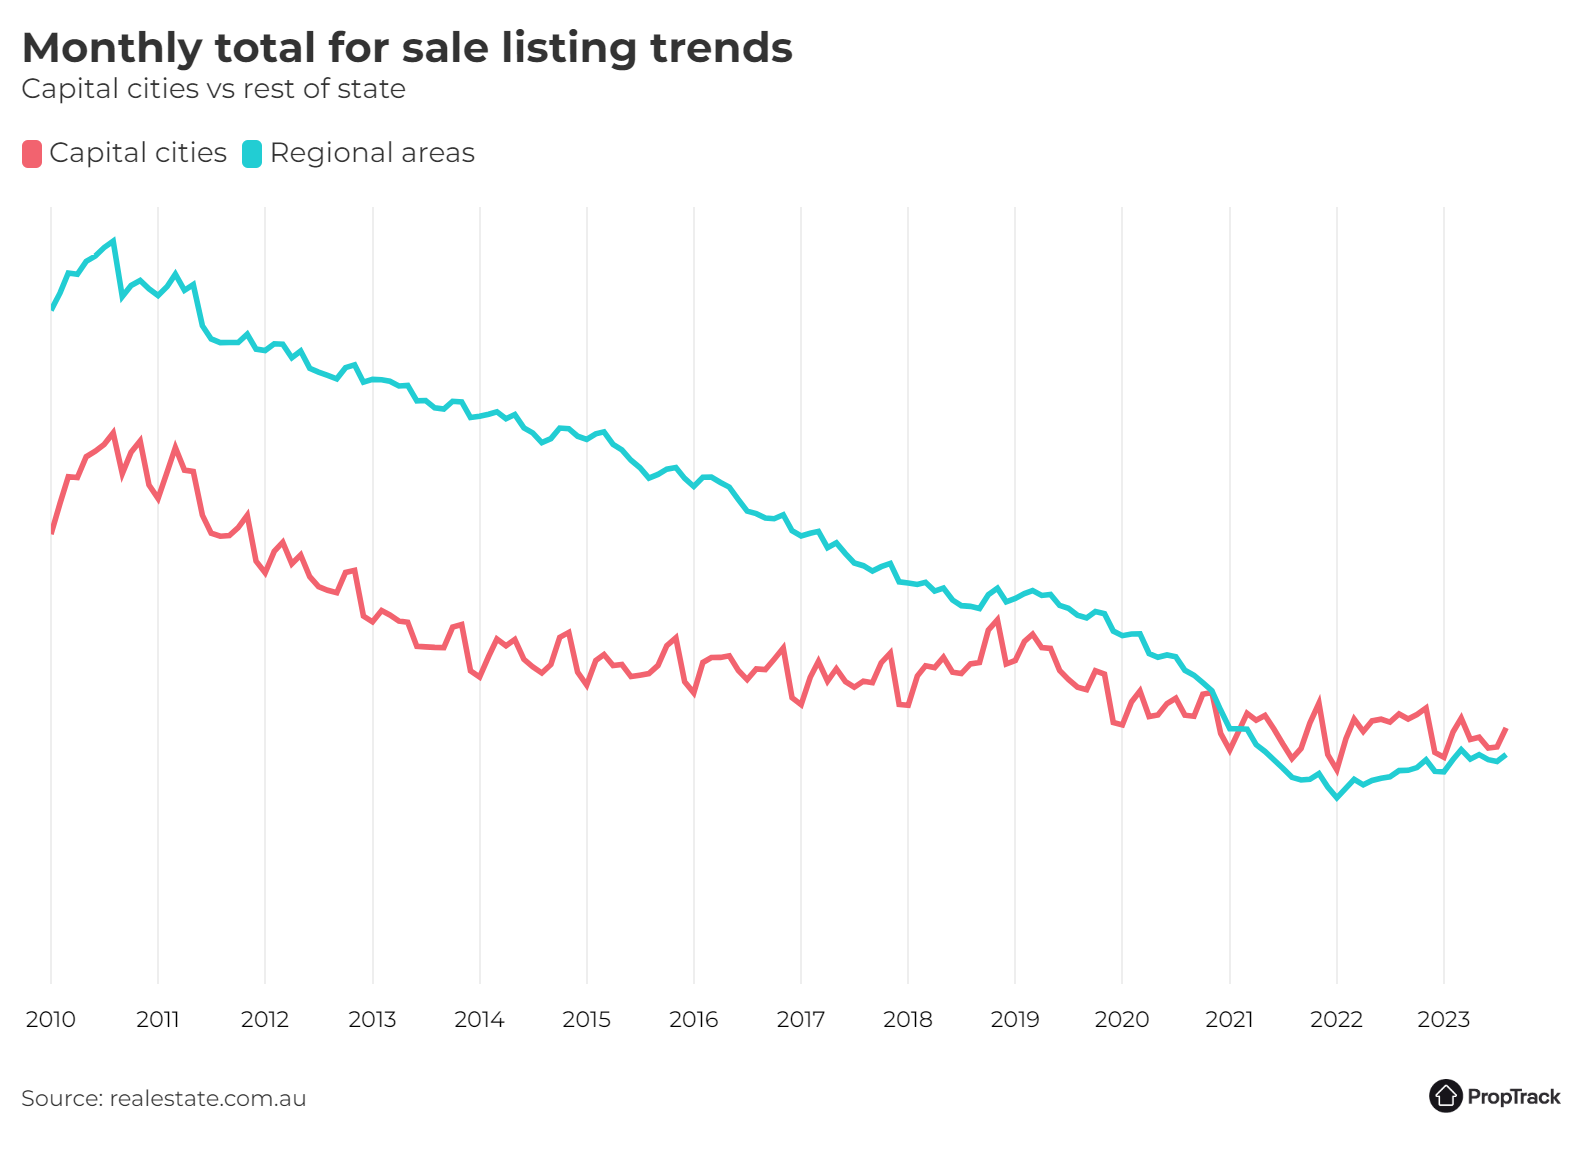
The busier month helped to improve choice for buyers, with the total number of properties listed for sale in August lifting solidly compared to July. The total number of properties listed for sale across Australia increased 5.7% month-on-month in August to be marginally above where it stood a year ago (+0.5% year-on-year).
But the national figures mask differences across the capitals. Buyers in Melbourne, Sydney, Canberra and Hobart are facing reasonably strong choice, with the total number of properties available for sale in these cities around the average over the past decade.
The same is not true for buyers in Brisbane, Adelaide and Perth, where choice remains much lower than what has been typical over the past decade. Buyers in Perth have particularly restricted options, with the total number of properties listed for sale close to a record low, despite improving a little in August.
Buyers searching in regional NSW and regional Victoria have seen substantial improvements in choice over the past 18 months after a period of incredibly limited options during the pandemic. In regional Victoria, the total number of properties listed for sale in August was just 4% below its pre-pandemic level – a marked turnaround from conditions in 2021 and early 2022.
Where to from here?
After a quieter first half of 2023, property market activity appears to be picking back up in Sydney and Melbourne, with both recording much busier than typical activity for August. Activity in many other capitals has picked up but remains subdued. Activity is likely to continue increasing over the next few months of the spring selling season for the typical seasonal peak in October and November.
Selling conditions and home prices have also picked up compared to late 2022. Home prices nationally have continued to recover, posting their eighth consecutive month of growth in August. Home prices nationally are now just 0.8% below the March 2022 peak. Auction clearance rates also remained solid through winter and have improved from their levels in late 2022.
The cash rate has remained steady at 4.1% for three consecutive months, and a stabilisation of interest rates looks to be within sight. While there may still be further interest rate increases, markets are pricing in only a small probability of that occurring. Inflation appears to be heading back towards target at a pace consistent with what the RBA was expecting.
Further out, the fundamentals of housing demand remain strong. Unemployment remains very low by historic standards, though it has edged higher recently. Rental markets remain extremely tight across much of the country, and rents are growing quickly amid strong demand and limited rental availability. International migration and population growth are forecast to remain strong, which will further add to housing demand.
Sydney recorded an active end to winter, with its busiest August for more than a decade.
Sydney’s property market continued to heat up ahead of spring, with a much busier-than-typical August. New listings surged 25.7% month-on-month in August, an unseasonably strong result, to record the busiest end of winter in a decade. That meant new listings were up 18.4% compared to August last year.
The busy month of new properties hitting the market helped improve choice for buyers across Sydney, with the total number of properties listed for sale in August up 10.1% compared to July. While still lower than at the same time last year (down 5.8% year-on-year), choice for buyers across Sydney remains reasonably good. There were more total properties listed for sale in August than has been typical on average over the past decade.
Regional NSW also saw activity pick up in August, with 19.2% more new listings in August than July. Even so, activity was marginally slower than at the same time last year (down 0.7% year-on-year).
The good news for regional buyers is that choice continued to improve in August, building on the marked improvement over the past 18 months or so after a period of extremely restricted options during the pandemic. Compared to a year ago, the total number of properties available for sale in regional NSW was up 15.8% in August. The total number of properties available for sale in regional NSW is now around 24% below its pre-pandemic level. While that is still a notable fall, it has improved more than 60% from the low in January 2022.
Victoria
Activity in Melbourne’s property market continued to firm ahead of the spring selling season, with a much busier-than-typical August.
Melbourne’s property market had a much busier than typical August as property market activity continued to heat up ahead of the spring selling season. New listings in Melbourne surged 24.9% month-on-month to record the busiest August for more than a decade. Compared to a year ago – when activity was subdued – new listings were up 20.8% year-on-year.
More properties hitting the market helped materially lift choice for buyers in Melbourne. The total number of properties listed for sale in August was up 9.4% compared to July, and 6.6% higher than a year ago. That brought the total number of properties listed for sale just shy of 10% above its average over the past decade.
Property markets in regional Victoria also had a busy August, though not to the same extent as Melbourne. New listings regionally were up 14.9% month-on-month to be 8.1% higher than a year ago. While a smaller increase than in Melbourne, that is notable for being the first year-on-year increase in new listings regionally since January.
The good news for regional buyers is that choice continued to improve in August, furthering the improvements seen over the past 12-18 months after a period of very restricted choice during the pandemic. The total number of properties listed for sale in August was up 37.8% compared to a year ago and is now just 4% below its pre-pandemic level.
Queensland
While activity picked up in Brisbane’s property market ahead of spring, it remained subdued compared to the pace seen last year.
Activity in Brisbane’s property market picked up in August, with 11.8% more new listings hitting the market than in July. Even so, activity remained subdued relative to the typical pace of activity for August over the past decade, and new listings were down 10.4% compared to a year ago.
The busier month of new properties hitting the market helped improve choice for buyers in Brisbane, with the total number of properties listed for sale increasing 5.8% month-on-month.
Notwithstanding the increase in the month, choice for buyers remains very limited and is well down on a year ago. The total number of properties listed for sale across Brisbane in August was down 14.1% compared to a year ago.
Regional Queensland also saw activity pick up following the mid-winter lull, with 15.5% more new listings hitting the market in August than in July. However, much like Brisbane, this August has seen a slower pace of activity than at the same time last year, with new listings down 9.7% year-on-year.
South Australia
Adelaide’s property market had a slightly busier-than-typical August, as activity began to pick up ahead of spring.
Activity in Adelaide’s property market picked up in August following July, which is typically the quietest part of the year. New listings were up 18.9% month-on-month, representing a slightly busier August than what has been typical over the past decade after a quieter-than-typical July. Even so, activity was still slightly slower than at the same time last year, with new listings down 3.3% year-on-year.
The busier activity in the month helped lift choice for buyers searching in Adelaide, with 7.9% more total properties available for sale month-on-month. However, it was not enough to reverse the declines seen through winter, and the total number of properties remains lower than a year ago, and much lower than pre-pandemic levels.
Regional markets also saw a much busier month in August than in July, with new listings up 26.1% month-on-month. That helped lift new listings to be higher than at the same time a year ago (up 7.3% year-on-year).
Western Australia
Choice for buyers in Perth improved in August as housing market activity picked up ahead of the spring selling season.
Activity in Perth’s property market picked up in August after the quieter winter months. August saw 17.9% more new listings hitting the market than in July. That jump contributed to a slightly busier August than is typical in Perth’s property market when compared to the past decade, though it was still a slower pace of activity than last year.
That busier month of activity helped improve choice for buyers a little, though choice remains very limited overall. The total number of properties listed for sale in Perth increased 4% in August compared to July. However, it remains 22.4% below its level a year ago after months of declines, and only just above the lowest level on record.
Regional WA also saw activity start to pick up ahead of spring, with 18.9% more new listings in August than in July. However, like Perth, activity this year still lagged the pace set last year, with new listings down 8.9% year-on-year.
Tasmania
Hobart’s property market had a slightly busier-than-typical August as activity began to pick up ahead of spring.
Hobart’s property market saw more new listings hitting the market in August, with new listings up 13.8% month-on-month, as activity began to ramp up ahead of the spring selling season. While recording a slightly larger monthly increase than is typical in August, activity still slightly lagged the pace set in 2022, with new listings down 1.8% year-on-year.
In regional Tasmania, the pick-up was even sharper, with 41.3% more new listings hitting the market in August than in July. This brought activity up 8.3% compared to the same time last year.
The busier pace of new properties hitting the market continued to improve choice for buyers in Hobart and regional Tasmania. The total number of properties available for sale in Hobart increased a further 3.4% month-on-month in August to be 32% higher than a year ago. The total number of properties available for sale across Hobart is now well above its pre-pandemic level, and just 4% below its average over the past decade.
Northern Territory
Activity picked up in Darwin’s property market ahead of spring, but lagged the pace set in 2022.
Activity picked up in Darwin’s housing market ahead of spring, with 24.1% more new listings hitting the market than in July. Even so, activity was still quieter than at the same time a year ago, with 5.4% fewer new listings this August compared to last year. That continued the trend of slower activity in 2023 compared to 2022, however, August represented the smallest year-on-year decline in new listings since late 2022.
The busier month of new listings helped improve choice for buyers, with the total number of properties listed for sale across Darwin in August lifting 3.4% compared to July. That helped to lift the total number of properties listed for sale across Darwin to be 4.9% higher than a year ago.
New listings were also up in the month in regional NT, which brought them higher than a year ago (+13.5% year-on-year). However, listings activity in regional NT can be volatile as it is a small market with relatively little activity each month.
Australian Capital Territory
Activity in Canberra’s property market surged ahead of spring, with a much busier than typical August.
New listings in Canberra surged in August as activity warmed up ahead of spring. New listings were up 38.9% month-on-month to be much busier than last August, up 23.2% year-on-year. While August is normally a busier month than July, the increase this year was unseasonably strong.
The busy month of new properties hitting the market helped lift choice for buyers, with the total number of properties listed for sale in August up 15.4% compared to July. That continued a period of solid choice for buyers in Canberra, with the total number of properties available for sale sitting nearly 20% higher than the average over the past decade.
Methodology
The ‘PropTrack Listings Report’ details monthly changes in the number of properties listed for sale on realestate.com.au. The listings are split into ‘new’ and ‘total’ listings.
New listings consist of properties that were newly listed for sale on realestate.com.au within the reported month.
Total listings is the total supply of properties for sale in the reported month. It consists of all listings which were for sale during that month (including new listings) irrespective of the date they first appeared on site.
The geographical areas described in this report are based on the Greater Capital City Statistical Area (GCCSA) as defined by the Australian Bureau of Statistics.
Disclaimer: PropTrack Listings Report is summary information only. realestate.com.au Pty Limited [REA] makes no representation whatsoever about PropTrack Listings Report’s completeness or accuracy. REA is under no obligation to update or correct any of the PropTrack Listings Report data or to continue to make the PropTrack Listings Report available. REA recommends that any users of the PropTrack Listings Report exercise their own skill and care with respect to their use of the PropTrack Listings Report and that users carefully evaluate the accuracy, currency, completeness and relevance of the PropTrack Listings Report for their purposes. REA expressly bears no responsibility, and accepts no liability, whatsoever for any reliance placed by you or others on the PropTrack Listings Report, or from any use of the PropTrack Listings Report by you or others. If you wish to cite or refer to this report (or any findings or data contained in it) in any publication, please refer to the report as the ‘PropTrack Listings Report – August 2023′.