National home prices reached a record high in September, entirely regaining the price falls of 2022 despite an uplift in the number of properties coming to market.
The PropTrack Home Price Index shows that the 2023 home price rebound has now fully reversed the most rapid decline in home prices in recent history.
With the spring selling season blooming, national prices climbed 0.35% month-on-month to peak levels. Prices are now up 4.31% so far this year.
Buyer and seller confidence is on the up and choice is improving significantly in the major capitals after a busy start to spring.
September marked the ninth consecutive month of national home price growth. After falling 4.10% from March 2022 to December 2022, national prices are now up 4.31% from the low point recorded in December and 3.75% higher than a year ago.
Download the PropTrack Home Price Index - September 2023 report in full
National home prices increased 0.35% in September to return to peak levels, marking the ninth consecutive month of increase. This has been the longest period of consecutive monthly growth since the pandemic boom, when prices grew for 23 consecutive months from May 2020 to March 2022.
This continued lift means prices nationally have grown 4.31% since December 2022, entirely reversing the fast falls of 2022.
This year’s recovery has brought national annual price growth back to positive, with prices 3.75% higher than a year ago.
While interest rate rises were the primary driver of home price falls for much of 2022, there are other factors, such as labour market conditions, the rate of immigration, home building, the supply of properties for sale, state of rental markets and interstate and regional migration, that all also affect home price growth, as well as how it is distributed across the country.
One driver of the recovery in home prices has been the subdued listings environment. In the first half of this year stronger housing demand and a limited flow of new listings hitting the market offset the impact of the substantial 400 basis points in interest rate tightening pushed through since May 2022.
Home prices have also been underpinned by stronger housing demand, bolstered by the rebound in net overseas migration, tight rental markets amidst shortages in rental supply and ongoing labour market tightness with slowly increasing wages growth and the unemployment rate holding close to multi-decade lows.
In Sydney and Melbourne increasing confidence amongst sellers has seen the flow of new listings surge, improving choice for buyers. Despite the uplift in the number of properties coming to market, home prices moved higher in September, with the uptrend now firmly entrenched as strong demand and positive sentiment see prices continue to lift.
Choice for buyers remains limited in Brisbane, Adelaide and Perth, heightening competition and seeing prices hit fresh peaks in each of these markets in September.
Capital city markets have led 2023’s price upturn while regional areas have grown slower.
That trend continued in September and prices in the combined capital cities set a fresh record high, climbing 0.41% month-on-month and reversing last year’s price falls entirely. Prices regionally rose 0.18% month-on-month in September.
Capital city markets outperformed their regional counterparts on a monthly basis in every state in September.
Prices in the capitals are up 5.41% this year, compared to 1.63% for regional areas. While capital city markets have taken the lead in the 2023 home price recovery and regained all of 2022’s price falls, regional markets remain down 0.78% from their April 2022 peak, despite prices holding up better for much of last year.
However, this comes after several years of outperformance and exceptionally strong growth during the pandemic. Home prices in regional areas are still up 48.2% since March 2020, while home prices in the combined capitals are up 30.5% over the same period.
All capitals, except Darwin (-0.01%), saw prices rise in September. Perth (+0.71%) led gains throughout the month, followed by Adelaide (+0.48%) and Sydney (+0.48%).
Home prices in Brisbane have already regained 2022’s price falls and are rising at a fast pace, jumping 0.39% in September to hit a new price peak. Prices are now 5.82% higher than a year ago and up 6.46% year-to-date.
Sydney home prices have increased for ten straight months, and increased a further 0.48% in September. That means prices are now up 7.43% from the low point recorded in November 2022 and are up 7.33% year-to-date to sit just 0.03% below the February 2022 peak.
Despite the sharp increase in the number of properties hitting the market, Melbourne home price growth accelerated in September, with prices climbing 0.25% month-on-month. This returned Melbourne to positive annual price growth for the first time since 2022, with prices 0.07% higher than a year ago.
Home prices in Melbourne are now up 1.66% from the low in January this year. Melbourne's recovery has not been nearly as sharp as Sydney, but it also did not see as large a decline in 2022, falling 5.76% from March 2022 to January 2023 compared to Sydney’s peak to trough decline of 6.94% from February 2022 to November 2022. As a result, prices in Melbourne are still 4.27% lower than the peak in March 2022.
Adelaide and Perth continue to be the strongest performing capital city markets over the past year, with prices at record highs in both markets after rising 8.31% and 9.24% respectively over the past year. Sydney follows as the third strongest capital city market for annual growth, with prices up 6.86% year-on-year in September 2023.
Regional South Australia (+9.86%) and regional Queensland (4.89%) are the strongest performing markets on an annual basis.
At the other end of the spectrum Hobart remains the weakest performing market when comparing annual price growth and change from peak, with prices down 6.60% from the March 2022 peak despite rising 0.09% in September. However, this comes after several years of outperformance as well as strong growth during the pandemic. Home prices in Hobart are still up 38.4% since March 2020.
Prices for detached houses nationally grew 0.38% in the month, while unit prices grew 0.19%. House prices have grown more quickly over the past year and are now 3.78% higher than a year ago, while unit prices are up 3.60% on their year ago levels.
Markets in parts of SA, WA and regional Queensland were the top-performing areas over the past year, recording price growth of 9% or more over the past year.
These markets have largely avoided the downturn in prices, due to a combination of factors: more affordable homes, heightened interstate migration during the pandemic and very low stock on market, particularly in Perth where the total number of properties listed for sale is at a near record low.
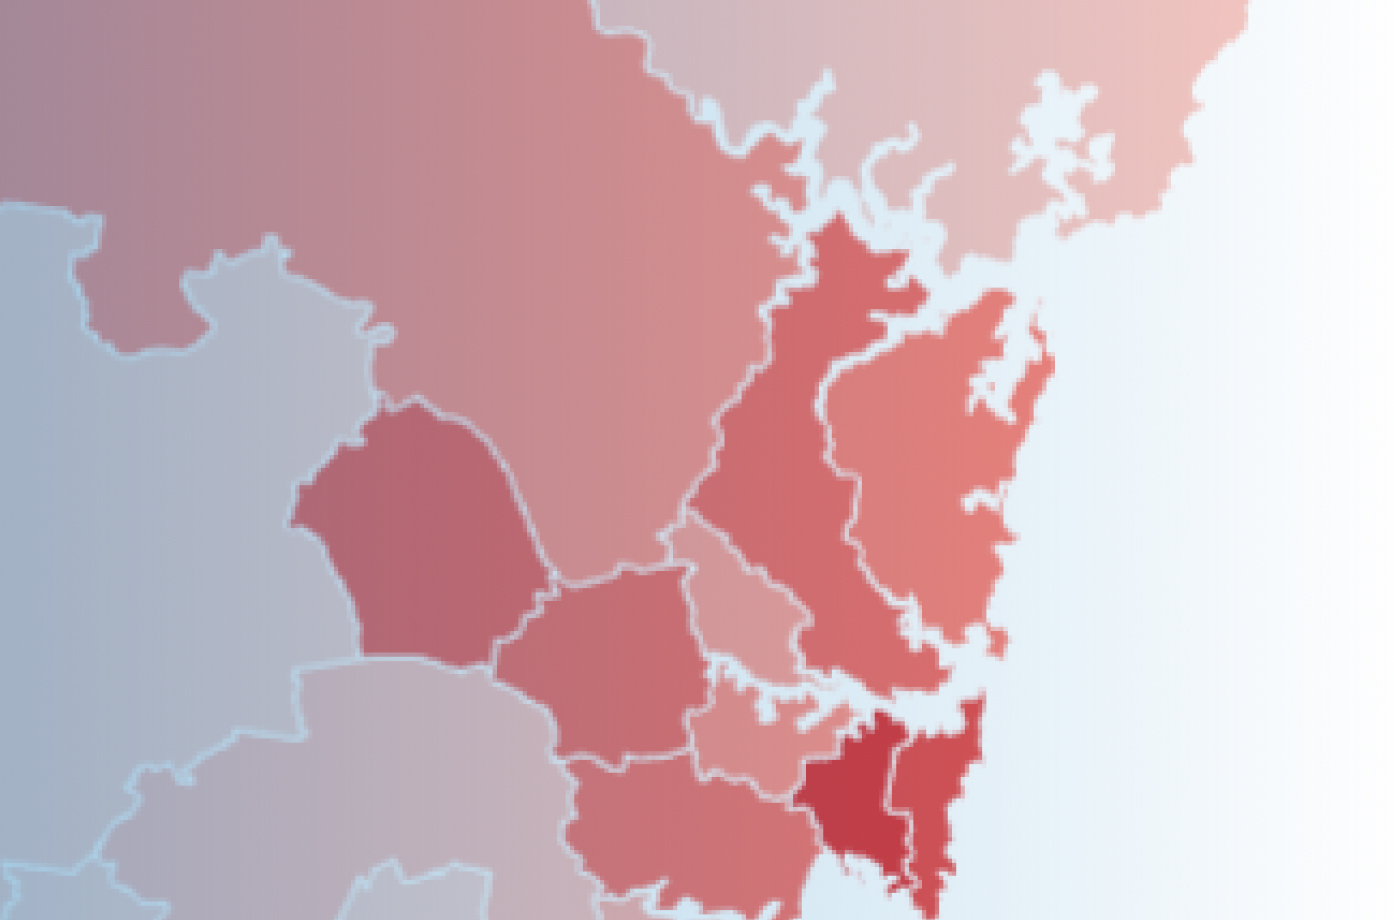
In September the Sydney - City and Inner South SA4 region was a new entrant to the list of highest growth regions over the past year, with prices 9.33% higher than a year ago.
Within Sydney, inner city areas had the strongest rebound in prices compared to a year ago, reversing the pattern seen earlier in the downturn when affordable peripheral areas were holding up better.
The story is fairly similar in Melbourne, however prices in the inner Melbourne region have not performed as well as prices in the east, particularly the inner east.
One driver of the recovery in home prices this year has been the subdued listings environment that meant buyers were competing for fewer properties. But home prices have also been underpinned by record levels of net overseas migration, a challenged rental market and an emergent housing shortfall.
Despite the uplift in the number of properties coming to market after a busy start to the spring selling season, housing demand is stronger, bolstered by the strength in migration, as well as very tight rental markets.
The unemployment rate is close to a multi-decade low, promoting a sense of job security. Wages growth, while running behind inflation, has also increased.
Confidence among buyers and sellers has increased, and nine months of price rises and more positive market conditions are likely to be drawing buyers off the sidelines.
In Sydney and Melbourne, the flow of new listings hitting the market has surged, but strong home buying demand has caused prices to continue to lift in September.
Choice for buyers remains limited in Brisbane, Adelaide, and Perth, sustaining buyer competition and solid selling conditions, with prices hitting fresh peaks in each of these markets in September.
As the recovery has broadened, numerous metrics reflect the improvement in conditions. Sales volumes have increased, auction activity has strengthened, and auction clearance rates are holding firm.
Many buyers and sellers anchor expectations from recent momentum, which can embed trends in market. Buyers are likely comforted by greater certainty around economic activity, continued low unemployment and talk of interest rates having reached their peak.
Unless there is a shift in the disinflationary outlook, it’s likely the peak in the cash rate is already in for this monetary policy tightening cycle.
Looking ahead, population growth is rebounding strongly, and with a shortage of new homes, prices are expected to rise and more markets will likely hit peak levels after recouping 2022’s fast falls.
Methodology: The PropTrack Home Price Index measures the monthly change in residential property prices across Australia to provide a current view on property market performance and trends. PropTrack Home Price Index uses a hybrid methodology combining repeat sales with hedonic regression. The repeat sales method matches resales of the same property while the hedonic regression estimates values based on the value of similar properties. The hybrid model allows two properties in the same Australian Bureau of Statistics Statistical Area 1 (SA1) region, of the same type, to be matched and controls for differences in property characteristics, as in a hedonic regression. The PropTrack Home Price Index is a revisionary index with the whole back history updated monthly with current transaction information.
** This report uses realestate.com.au internal data and data sourced from third parties, including State government agencies. It is current as at the time of publication. This report provides general information only and is not intended to constitute any advice and should not be relied upon as doing so. If you wish to cite or refer to this report (or any findings or data contained in it) in any publication, please refer to the report as the ’PropTrack Home Price Index Report – September 2023’. See report for Copyright and Legal Disclaimers.