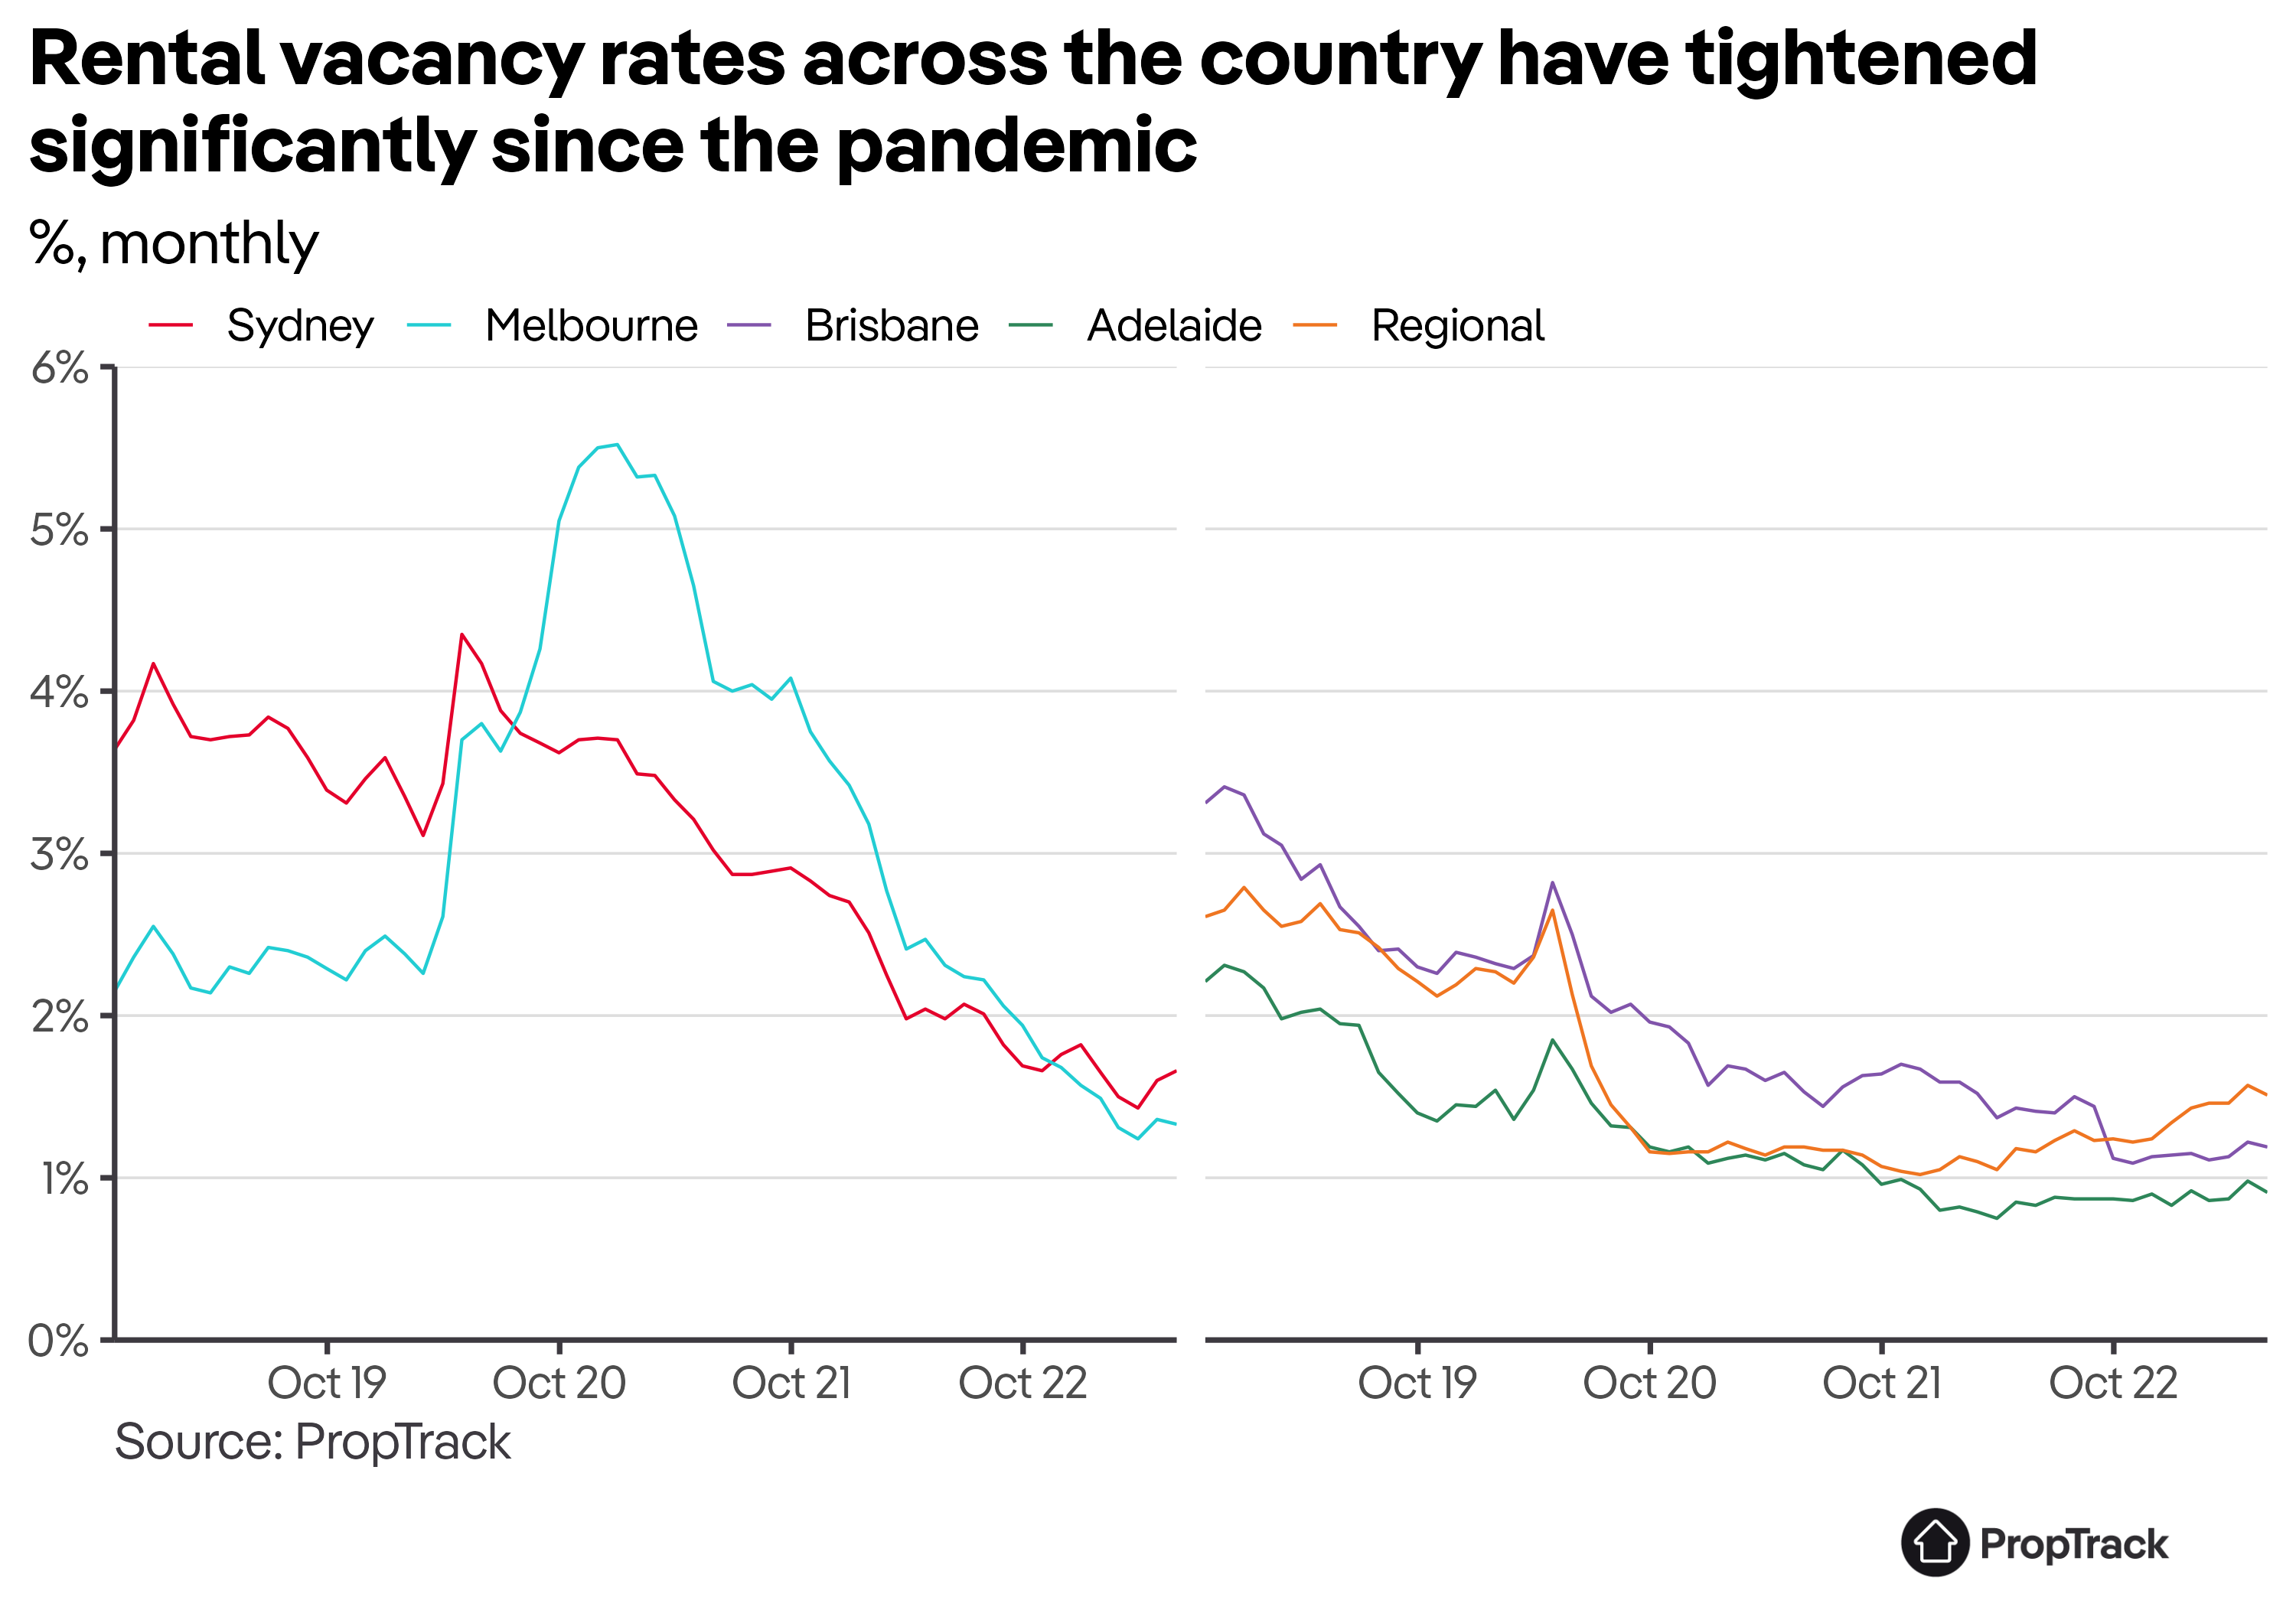
Vacancy rates have fallen to very low levels across the country since the pandemic. That means that available rentals are in short supply, and conditions are tough for renters.
In regional areas, and the smaller capitals, the decline in rental vacancy rates mostly happened in 2020; regionally, there are signs some regional rental markets are starting to ease. In Sydney and particularly Melbourne it’s a more recent change.
Why has this happened?
We’ve written a lot about how renters moving out of sharehouses into smaller households has increased demand for rentals, about the regions where markets are tightest and where things are improving, how the supply of rental properties and investor activity has changed, and how tenants are adapting.
But why are rental vacancy rates so low right now? What has driven that change? And what does that tell us about the state of the rental market?
First, a definition.
A rental vacancy rate is a point-in-time estimate of rental availability. It measures the number of rentals that were available to rent on realestate.com.au at the end of each month, as a share of the total number of rental properties, occupied or vacant.
Two things drive how many rentals are vacant at any given time.
The number of available rentals at any given time is just the product of these two drivers: if 10 rental properties are vacated each day, and it takes 15 days to fill each vacancy, there’s 150 vacant properties on any given day.
In practice, there are a few wrinkles. But none of these are especially material, and they require a bit of algebra to explain, so I will relegate them to a footnote.[3]
If rental properties were still turning over at the same rate they were pre-pandemic, the vacancy rate would be a bit over 0.5ppt higher than it is today – i.e close to 2%, instead of the 1.4% recorded in May. Instead, rental turnover has fallen, implying that tenants are staying longer in their existing rentals today than they used to.
Similarly, rentals are leasing faster when they become vacant than they were pre-pandemic. This change has dropped rental vacancy rates a little under 0.5ppt.
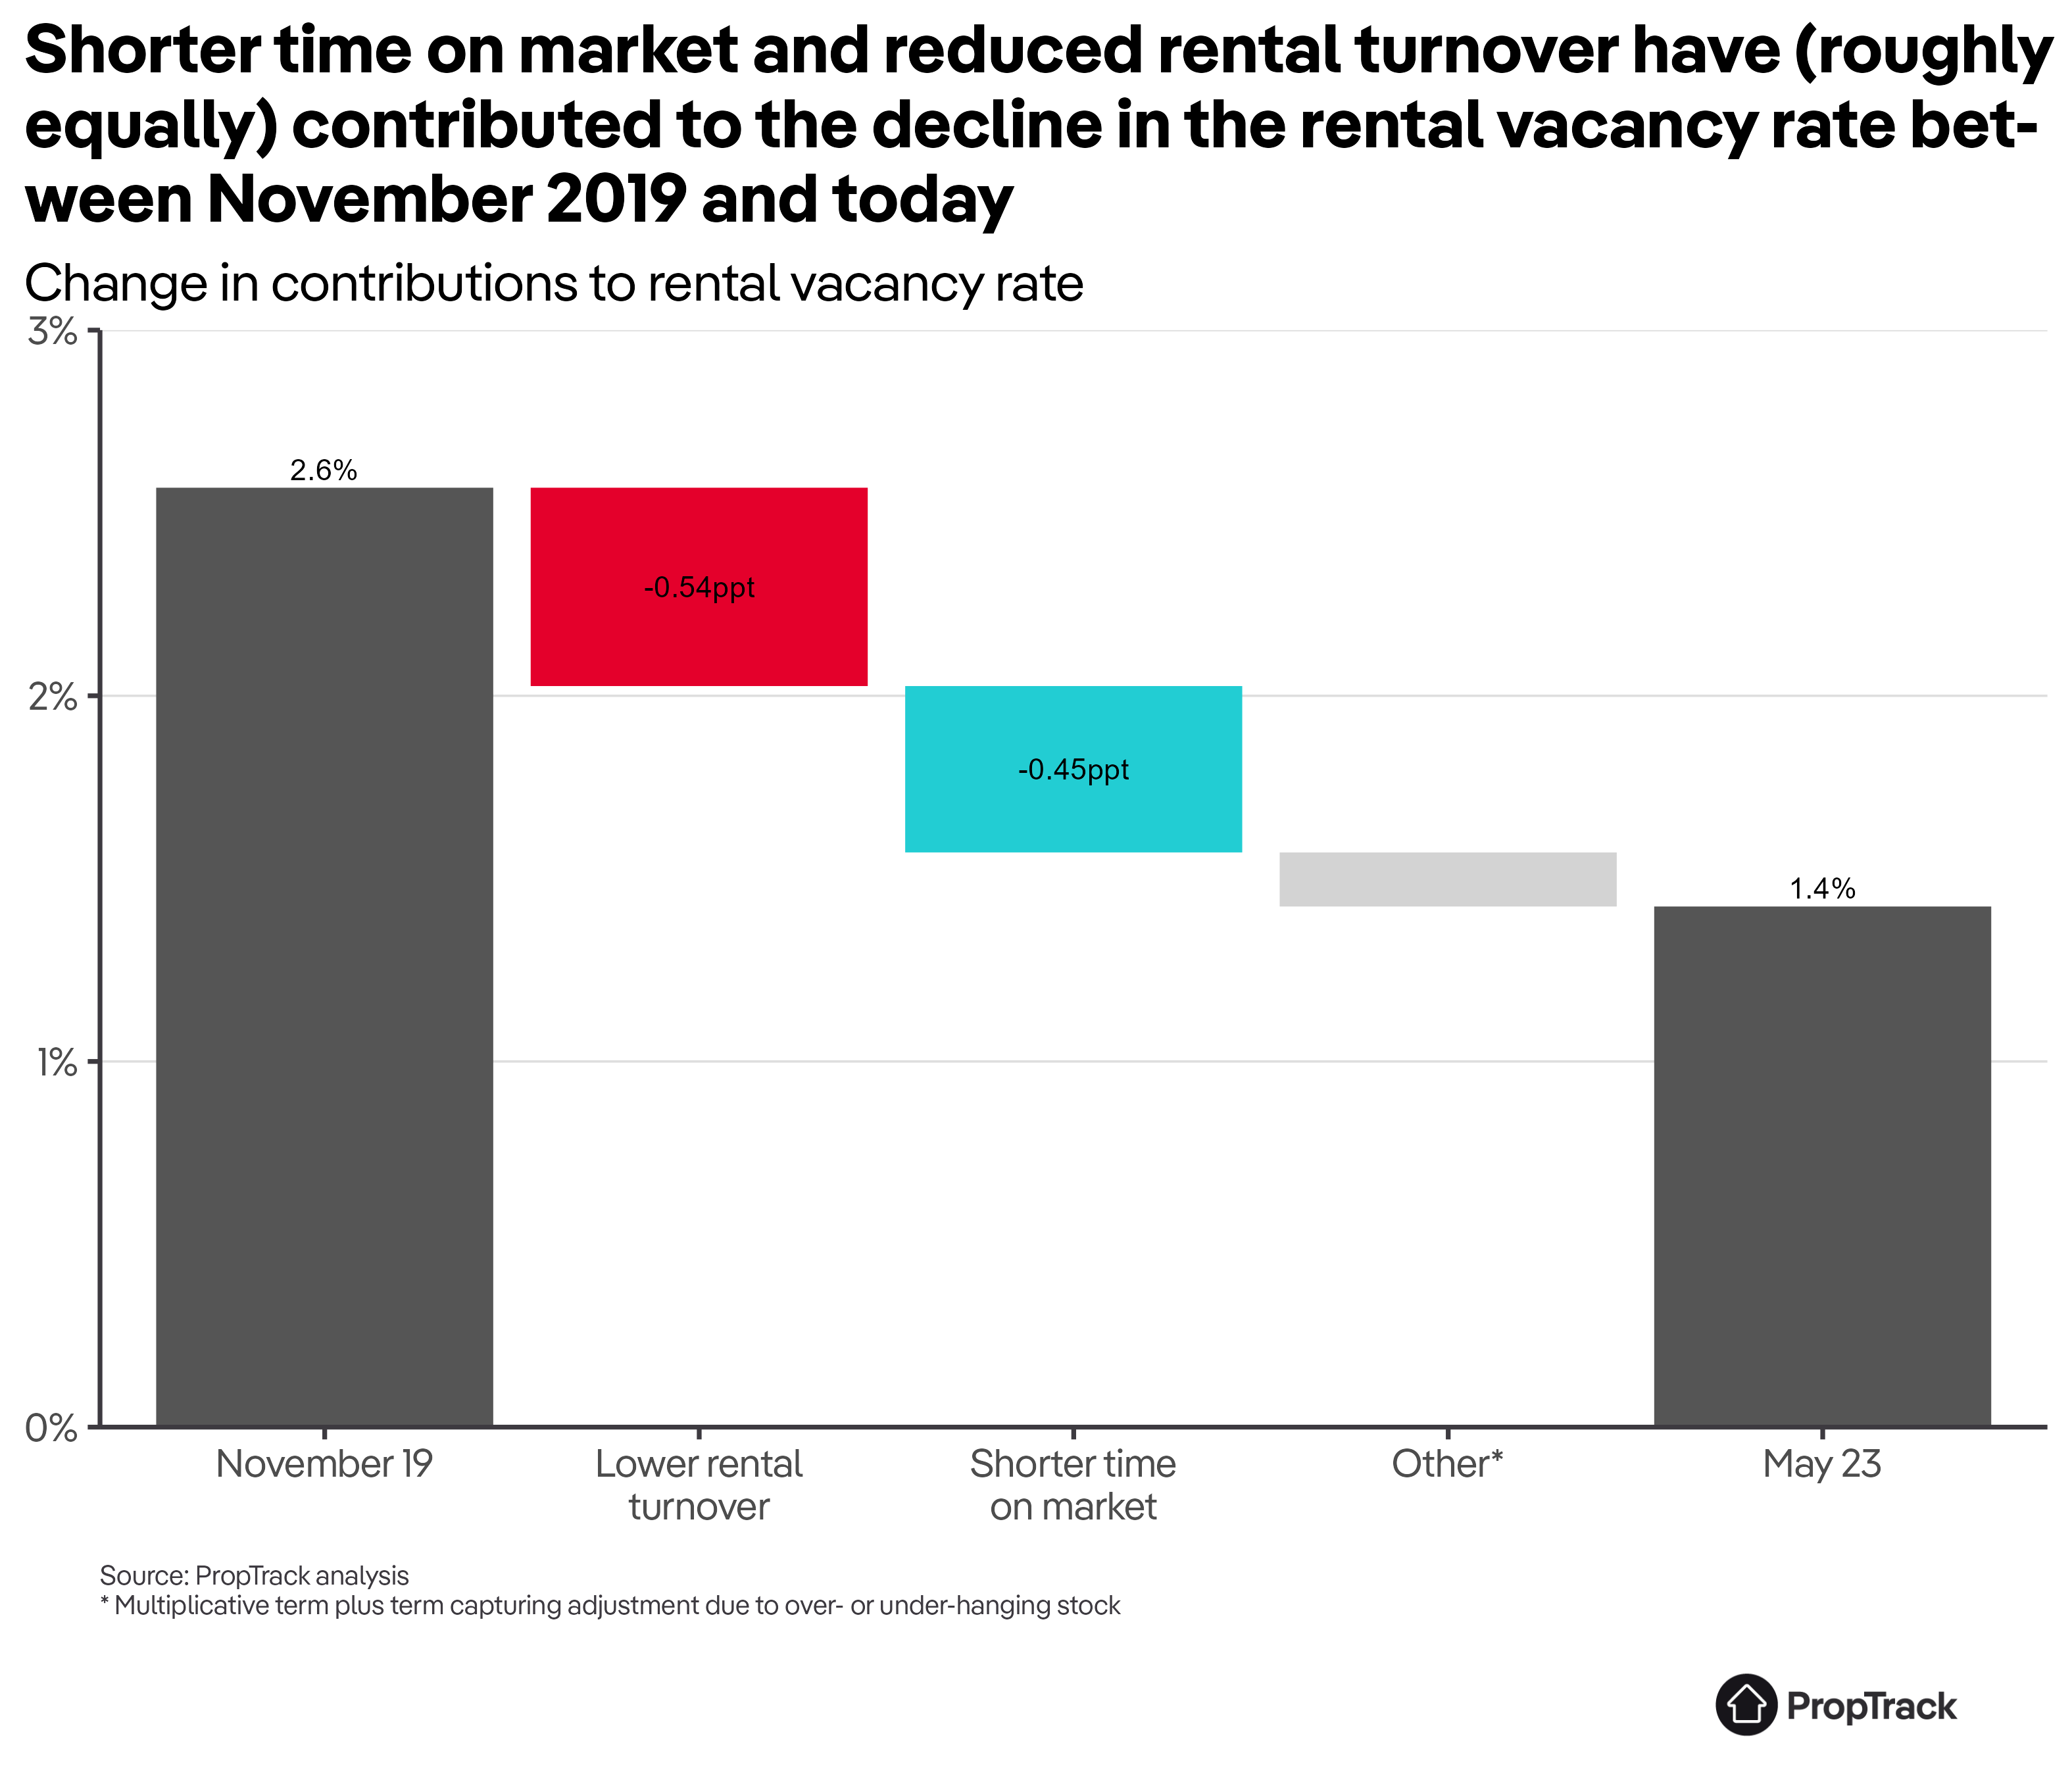
While both drivers have contributed roughly equally to the change in the vacancy rate between today and pre-pandemic, that wasn’t the case earlier in the pandemic.
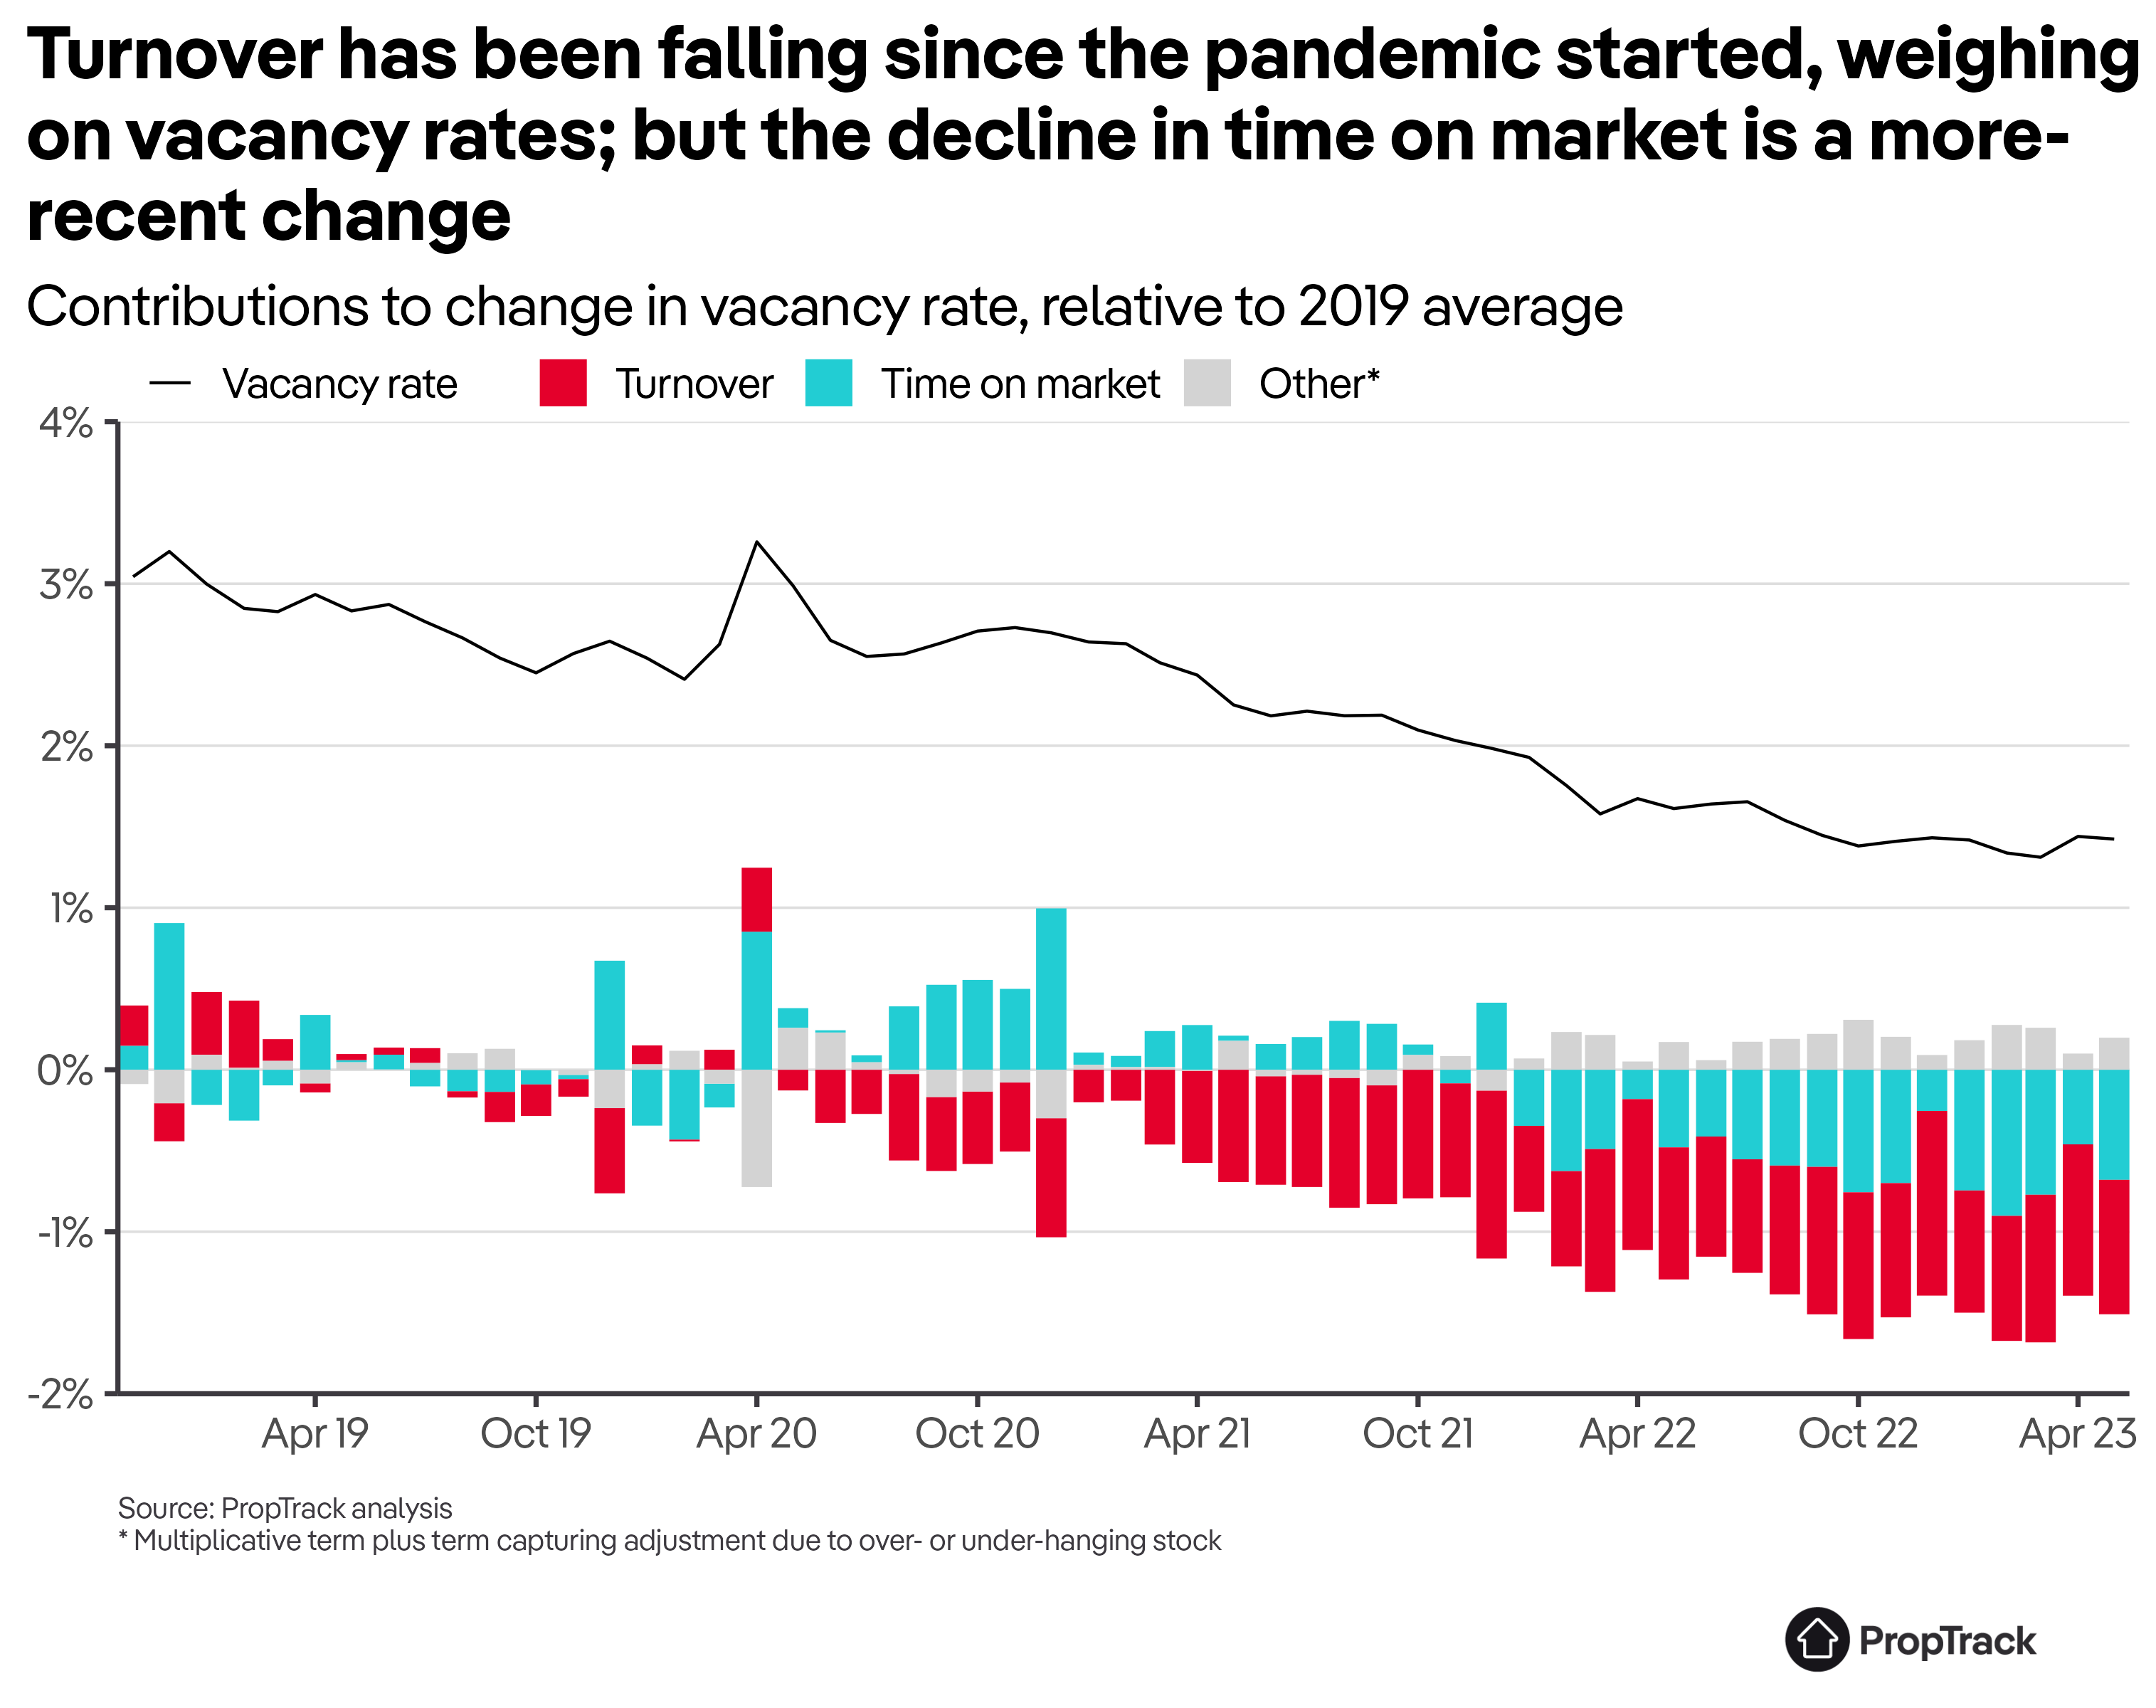
The decline in turnover happened much sooner, and began to weigh on vacancy rates from as early as mid-2020.[4] More recently, while turnover is still lower than pre-pandemic, its impact on vacancy rates has been fairly steady for the past year.
In contrast, shorter time on market started to weigh on vacancy rates from around the end of 2021, and was actually supporting higher vacancy rates during 2020 – largely driven by longer time on market in Melbourne (and to some extent Sydney).
Other measures of time on market show a similar story.[5] Median days on market for rentals were still around pre-pandemic levels in capital cities in early-to-mid 2021, and only really started declining after that; the same was not true in regional areas, which declined much earlier.
This decomposition is helpful for telling us what has happened to rental vacancy rates, but it can’t tell us why.
Higher rents are a plausible explanation for why tenants are staying longer in their existing rentals. Given how quickly newly advertised rents have risen, many tenants are probably finding it attractive to stay where they are, in the hope of smaller rent increases. (To date, that’s what we’ve seen: overall rents, as measured by the CPI, have not risen as quickly as advertised rents).
But it probably isn’t the whole answer. Turnover started declining in 2020, before (national) rents took off.
The decline in time on market is easier to understand: the number of renters searching for a rental, relative to the number of vacant rentals has increased. With more renters for any given vacancy, it is easier for a landlord to find a new tenant.[6]
Of course, these changes are all interrelated. Rents are rising because of tight rental markets; but, as we just saw, part of why vacancy rates are low is probably, in part, due to higher rents! This exercise isn’t meant to (and can’t) fully account for these feedback mechanisms.[7]
The unfortunate news for renters is neither of these changes – lower rental turnover and shorter days on market – seem likely to reverse quickly. That means rental vacancy rates are likely to stay low, and rental markets are likely to stay tight for some time yet.
[1] And how many new / first-time rentals are being added to the market.
[2] This is not quite the same as the measure we typically report for time on market, which is median days on market. For the decomposition here I make some simplifying assumptions and so can’t use that measure.
[3] Key assumptions here include: probability of a vacancy being filled in a given period is uniform across properties and the rental stock isn’t growing. The former assumption is needed so that we can easily convert between the probability of a vacancy being filled and the average time it takes to fill a vacancy. The latter just simplifies the decomposition, and, as I’ll show below, in practice isn’t a large term, so won’t matter too much.
The final simplification I’m making here is that the product of time on market and turnover describes an equilibrium vacancy rate (i.e where the vacancy rate would settle after a sufficiently long time). In practice, there will be an adjustment period. I.e if there were no vacancies to begin with, and then we move to a situation where 10 properties are turning over each period, taking 10 days to fill: on the first day there would only be ~10 properties vacant, not 100.
To be precise, we can describe the evolution of the vacancy rate as:

Where "new" is the number of rental properties that are vacated/become available in period t, "leased" is the number leased, "available" is the number of vacant rentals from the prior period, and "stock" is the total number of rental properties (occupied or vacant) in the prior period.
We can then express this as:

And then defining θ as the turnover rate in period t, ω as the leasing rate (leased properties as a share of the number of vacant rentals), and Δs as growth in the rental stock:

Define the “equilibrium” vacancy rate, for a given turnover and leasing rate, as the vacancy rate such that the vacancy rate is constant for time t and t-1; this equilibrium rate is still indexed by time, because the turnover and leasing rate vary over time. Substituting in the definition of the equilibrium rate to the equation for the evolution of the vacancy rate gives:

For small Δs (which is a fairly innocuous assumption – growth in the rental stock is more than two orders of magnitude smaller than the leasing rate), this simplifies to the "equilibrium" relationship described above:

Where T is the time to lease a property as is equal to the inverse of ω (assuming ω is uniform).
We can also re-express the equation for the actual vacancy rate in period t as a function of its equilibrium rate and a transition term (how far the vacancy rate last period was away from the equilibrium rate), again ignoring the Δs term for simplicity:

I lump this latter adjustment term in the “other” term in the decomposition. In practice it is fairly small when changes in θ or ω are gradual and so can be ignored. (The start of the pandemic in April 2020 is a good counterexample: the equilibrium rate initially jumped much higher than the actual rate, as both turnover and time on market jumped sharply).
[4] The decline in 2020 could, in part, be due to fewer new investors during 2020 and 2021 (and therefore new properties), meaning fewer new rentals hitting the market during this period.
[5] These measures are not directly comparable because of differences in calculations and simplifying assumptions for this decomposition (see footnote 2).
[6] An analogy can be drawn here to the Diamond-Mortensen-Pissarides search model, where the probability of a job being filled (here a tenant being found) is a function of the ratio of job seekers (searching renters) to job vacancies (rental vacancies).
[7] Similarly, rental turnover, in part, feeds back in to how many renters are searching; vacating renters need somewhere to live. But renter households are not static, and so the mapping isn’t one-to-one. For instance, as during the pandemic, one vacating sharehouse could turn into multiple smaller renter households; nor does a vacating renter necessarily need a new rental (they could be moving into owner-occupation, overseas, back in with parents, etc). Similarly, renter households need not come only from existing rentals, e.g they could currently be living with their parents, or living overseas.