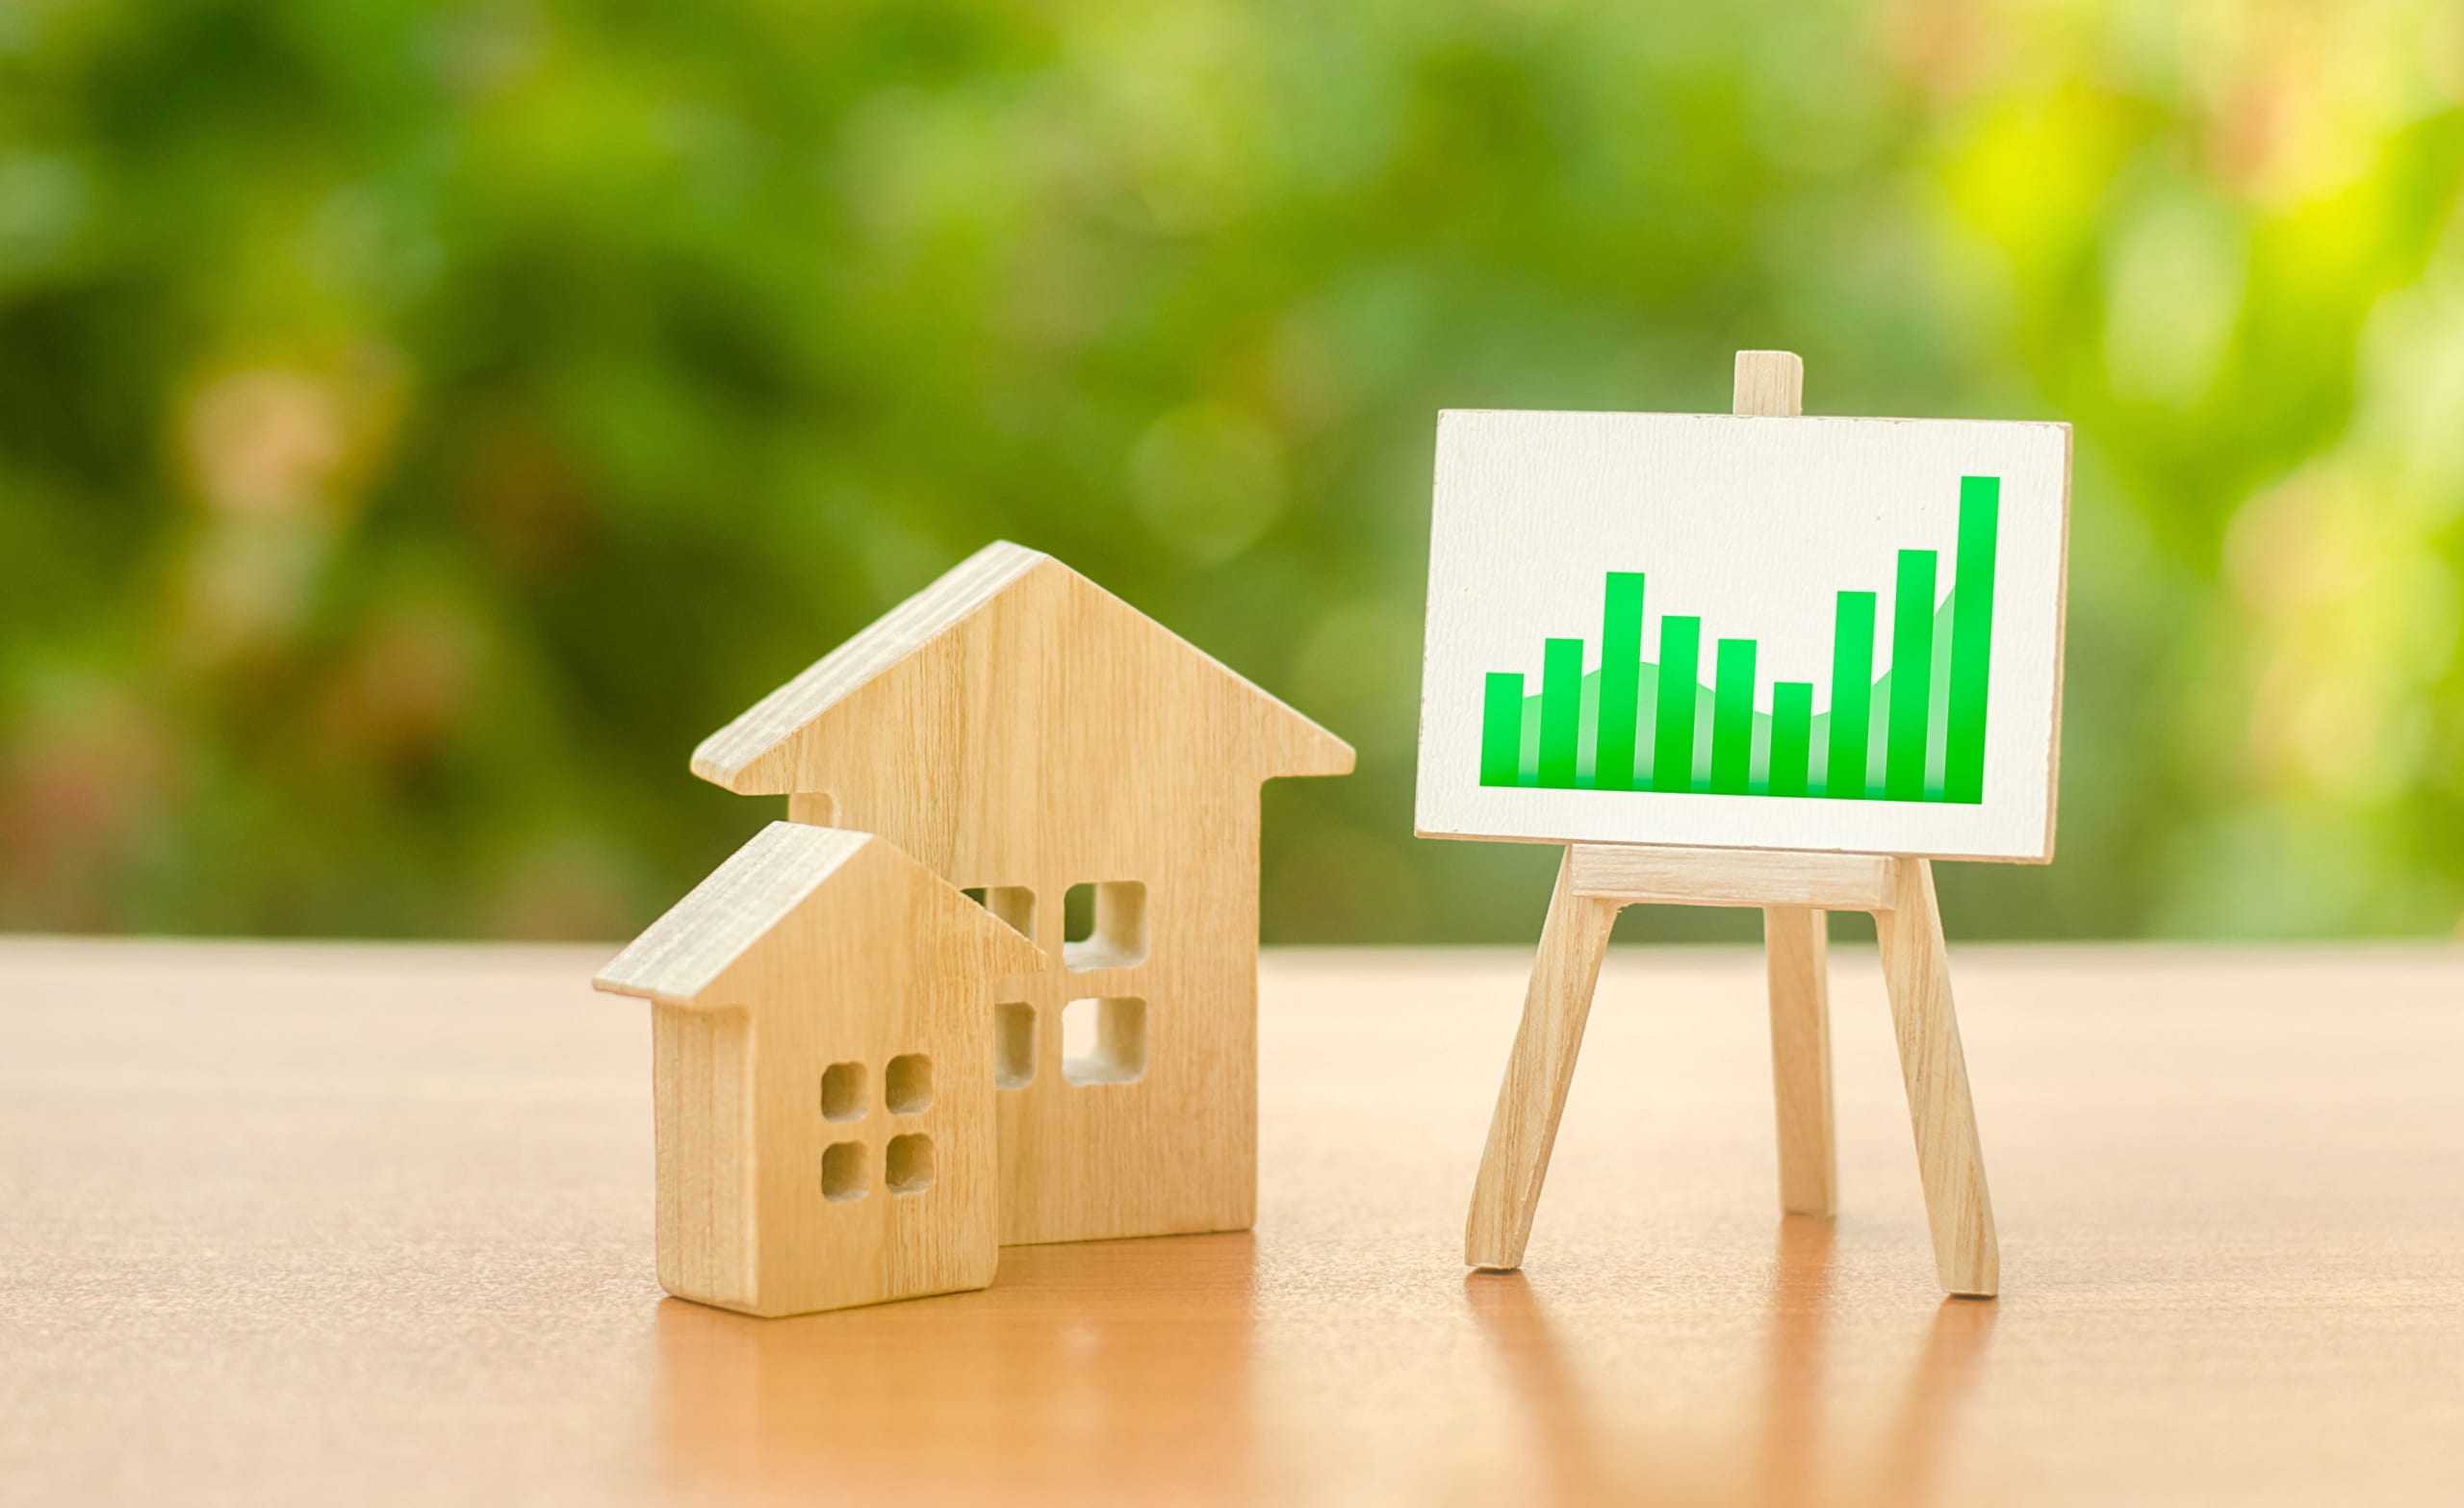
The trend is clear - the gap between the price of houses and units is widening.
This has not always been the case.
House and unit price growth started to diverge in late 2021. In September 2021, the national median house price was $570,000, 9.6% higher than the median unit price of $520,000.
But fast forward to May 2023, and the typical house costs $725,000, which is 30% higher than the price of a typical unit.
This has mainly been driven by the differential in house and unit price growth in the capital cities. The median house price is 31.6% higher than five years ago, but units have only increased by 9.8%.
A large driver of the increase was the onset of the pandemic.
The closing of the border, and the loss of overseas students and workers, had a detrimental effect on the inner-city unit market, as a flood of empty apartments drove investors to sell up. As a result, the oversupply of units reduced demand and, subsequently, prices.

At the same time, the shift to ‘work from home’ drove property seekers to look for houses with more room for a study and a bigger outdoor space. This trend increased competition, driving up house price
Further, the pandemic-era, record-low interest rates made borrowing more money cheaper. People who in the past may have only been able to afford a unit could now compete for houses, further pushing up prices.
Government incentives, such as the HomeBuilder scheme, were primarily targeted toward houses, incentivising housing construction and renovations.
Hobart has recorded the highest five-year growth of all the capitals. Hobart had already been experiencing a housing shortage that pre-dated the pandemic, exacerbated by pandemic-induced lifestyle preference changes.
In fact, Regional Tasmania also outperformed the other regional areas, increasing by 78.7% over the past five years.
Adelaide and Brisbane also experienced high demand in 2021/22, pushing growth higher than the other capital cities.
Regional Queensland was the winner of the pandemic period, with record interstate migration, pushing up prices. Over five years, the median home price increased by 57.3%.
Regional Victoria and New South Wales also benefited from the pandemic-induced preference shifts, as city dwellers moved further away from the city to take advantage of more affordable, larger homes. As a result, the median house price in both areas grew 52.9% and 51.7%, respectively.
Units were also in high demand during the pandemic, but not as much as houses.
The shortage of properties in Hobart has increased the demand for units and sent prices skyrocketing, resulting in a five-year growth rate of 49.2%.
However, in most cities, demand has been much lower for units, resulting in five-year median price growth ranging from 2.18% in Melbourne to 29.3% in Canberra.
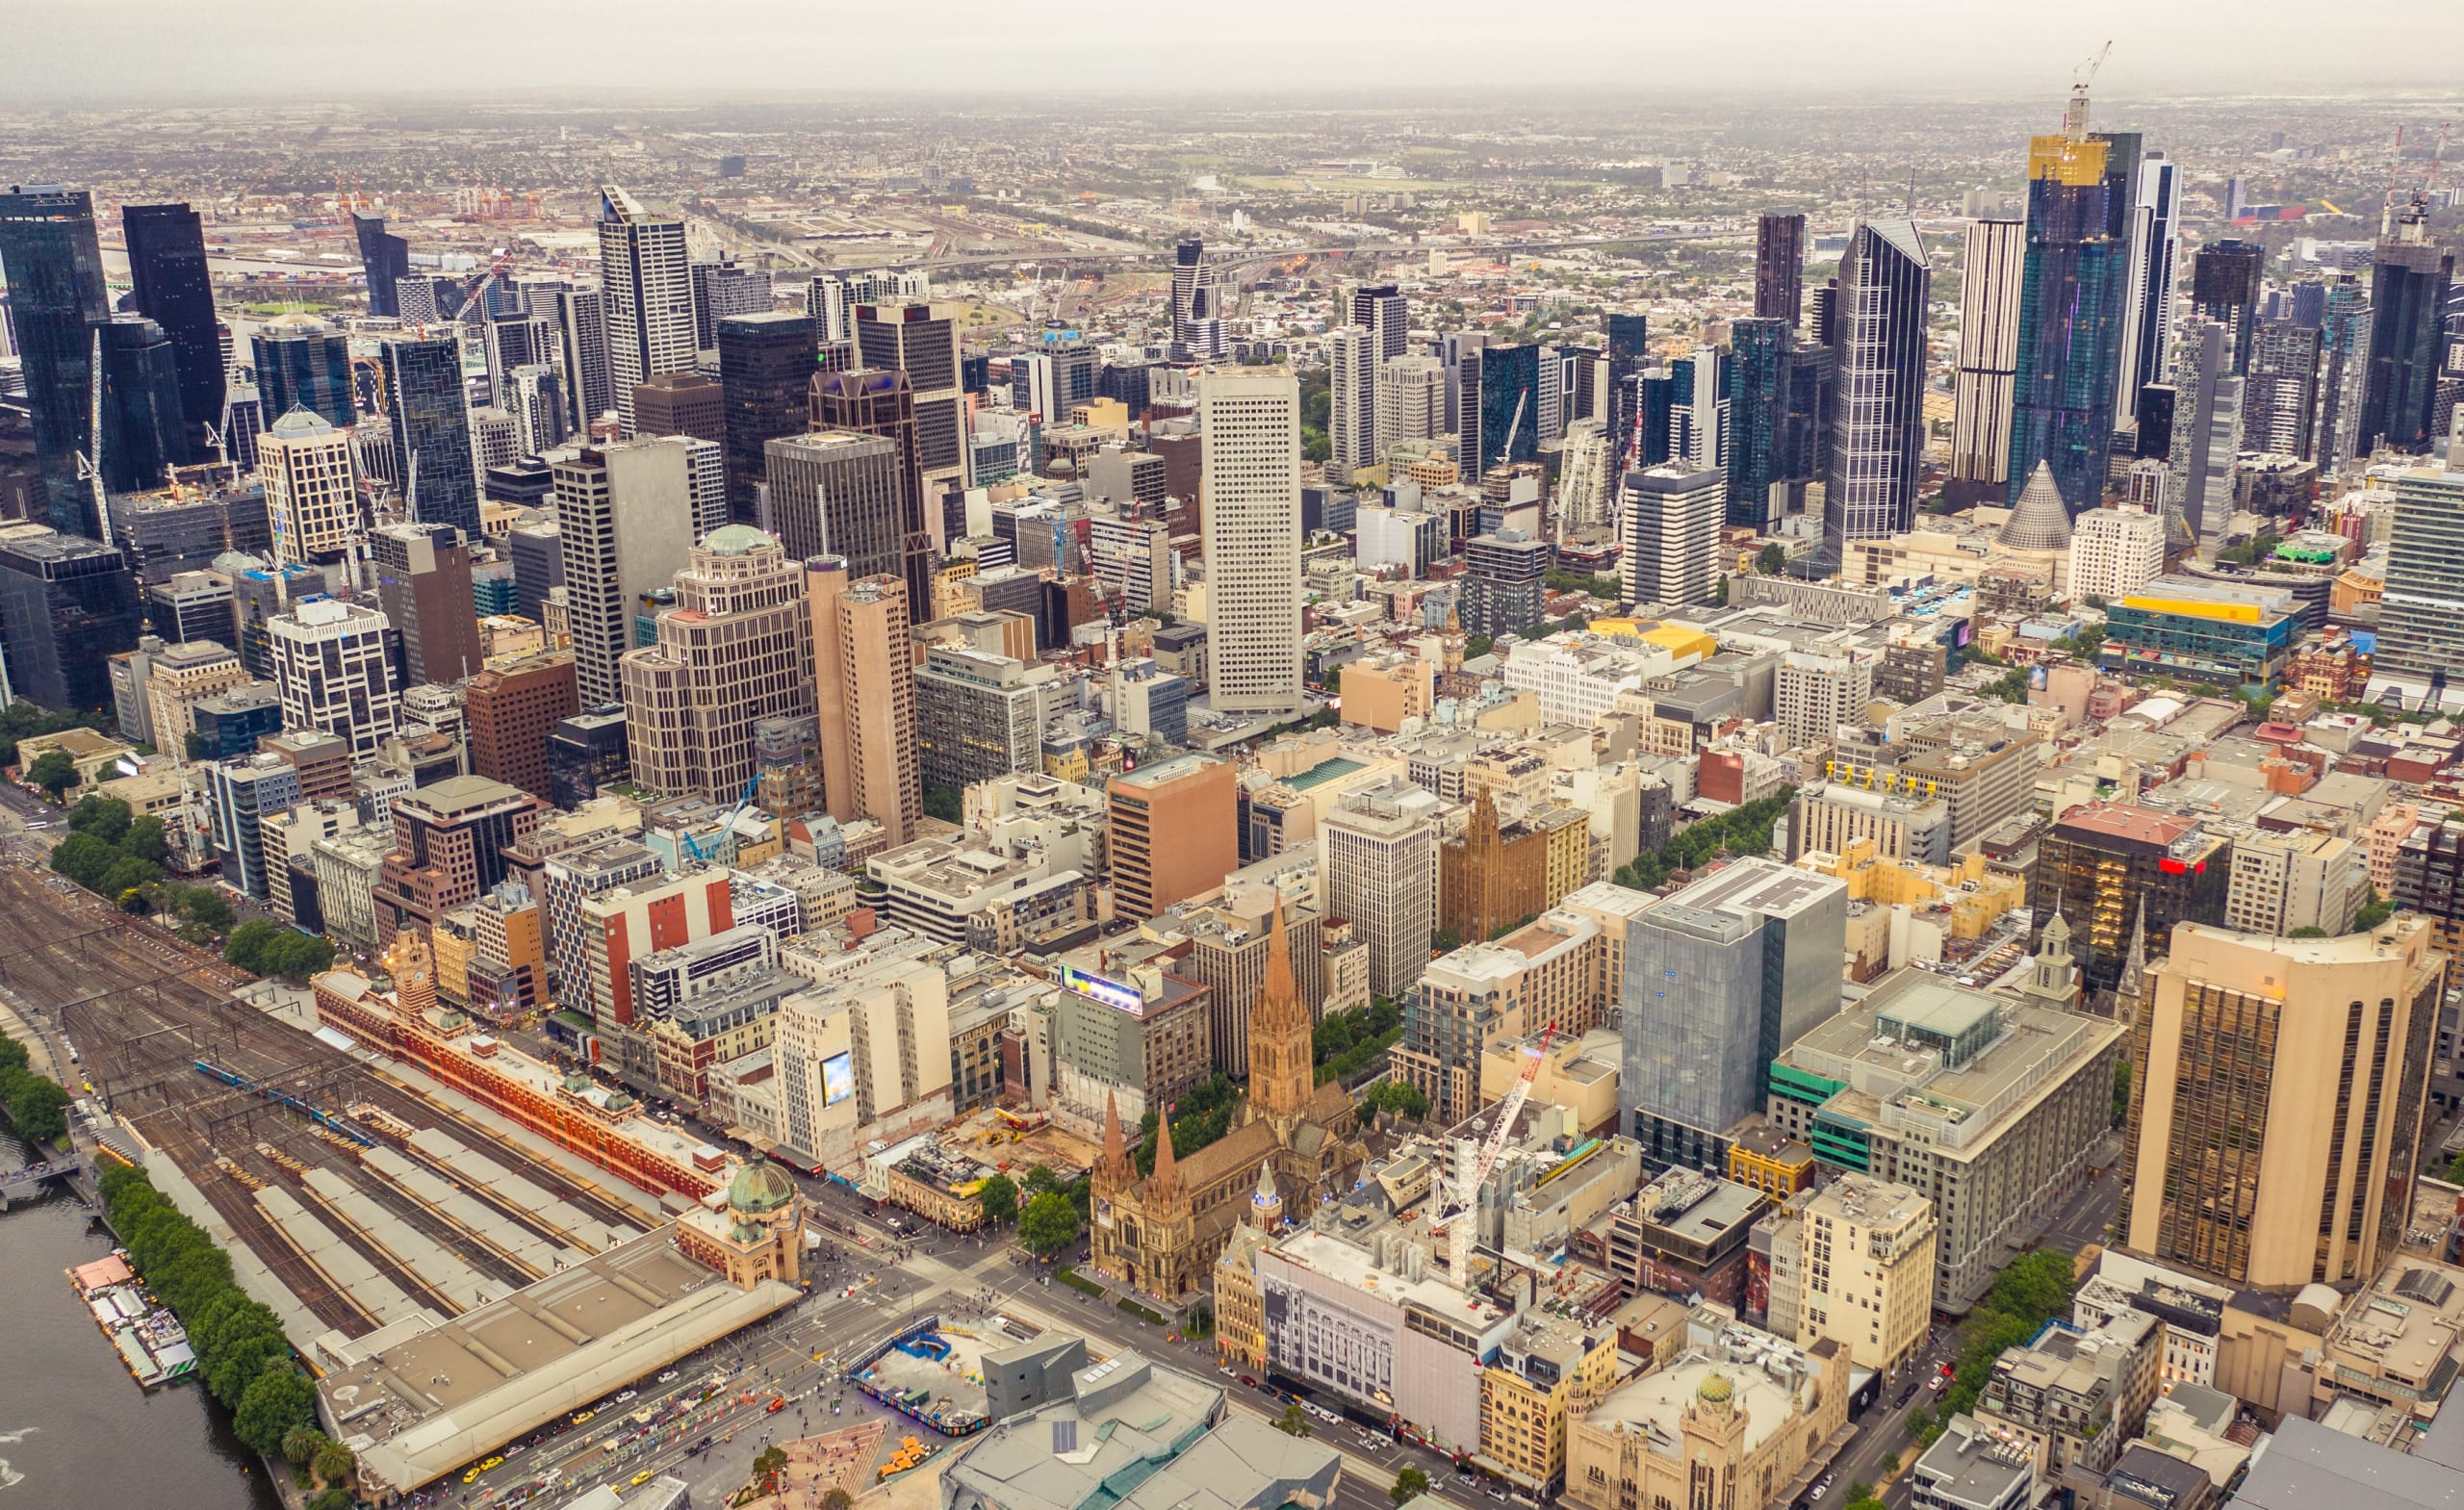
Greater Sydney has the largest median house and unit prices gap at 74.5%. At the start of the pandemic, it was only 29.1%.
Sydney’s inner-city unit market suffered from the initial lockdown, driving down unit prices. At the same time, the increased demand for houses, particularly in blue-chip areas, sent prices skyrocketing.
The gap between houses and unit prices in Hobart has mostly held steady over the past five years, and this is due to the significant increase in house and unit medians driven by the housing shortage.
Five years ago, there was a 27% difference between the two medians; now, it is 30%.
The high demand for houses in regional Victoria during the pandemic drove a gap of 41.6% between the house and unit median price. In contrast, the demand for both houses and units in regional Queensland has reduced the gap between the median prices.
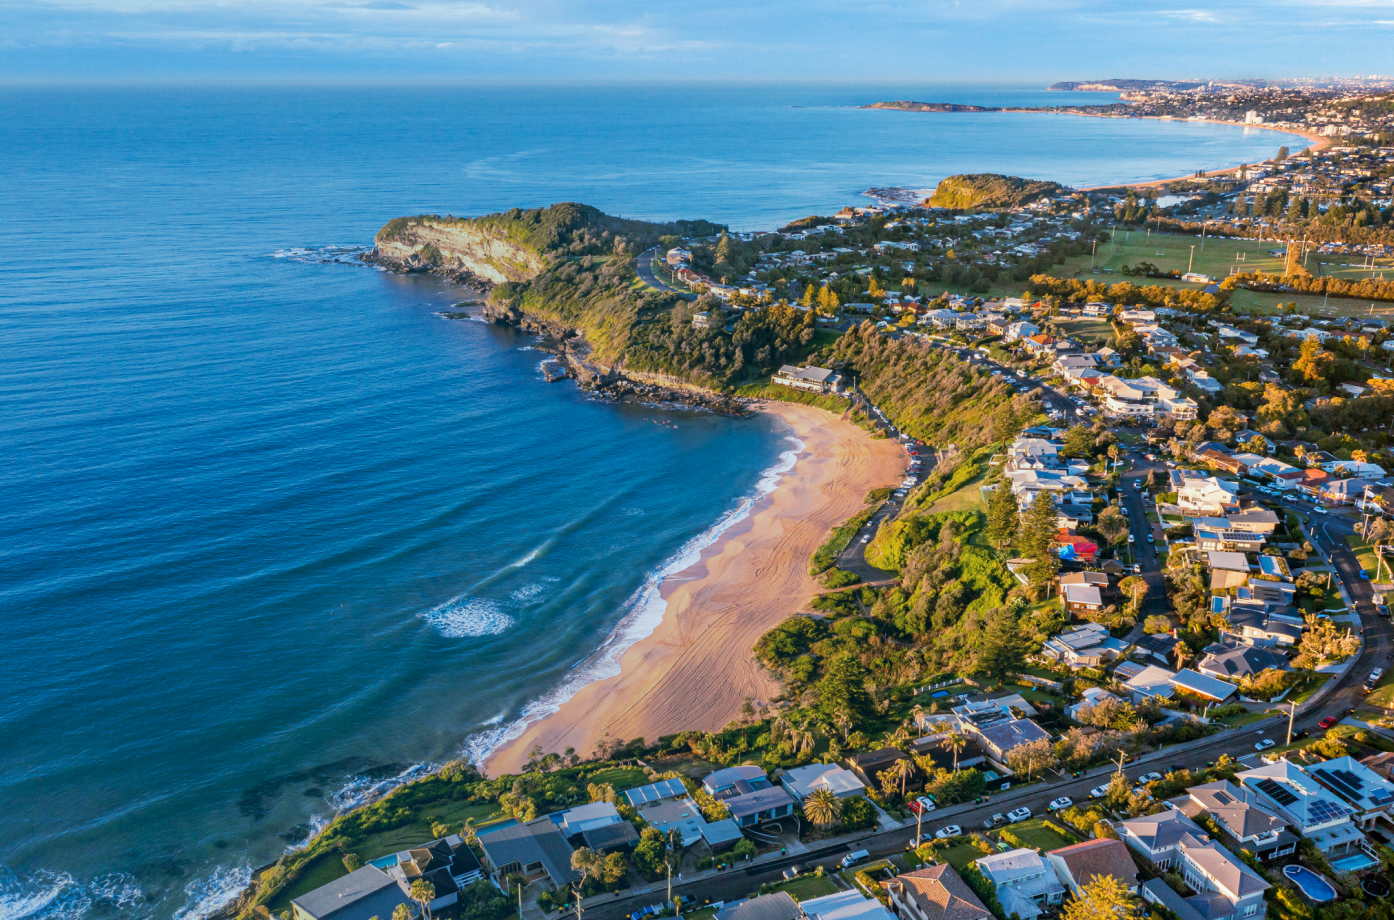
Another factor that impacts the price of houses, more than units, is the availability of land in the inner city compared to regional areas.
As land is a limited resource, especially in desirable areas such as Sydney, its scarcity contributes to higher house prices.
An empty plot of land in the cities is more likely to be used to build an apartment block, maximising the return on investment for the developer rather than just one house. And, as time goes by, available land will decrease, pushing house prices up even further.
To illustrate how much the price of land differs across the cities and regions and how much the price has increased, the chart below shows the median price per square metre of houses listed on realestate.com.au.
Greater Sydney commands the highest price per square metre of all the capitals, having increased by 37% since the pandemic’s start.
The scarcity of land and the ongoing desirability of space suggests the gap between the price of houses and units is likely to keep increasing.