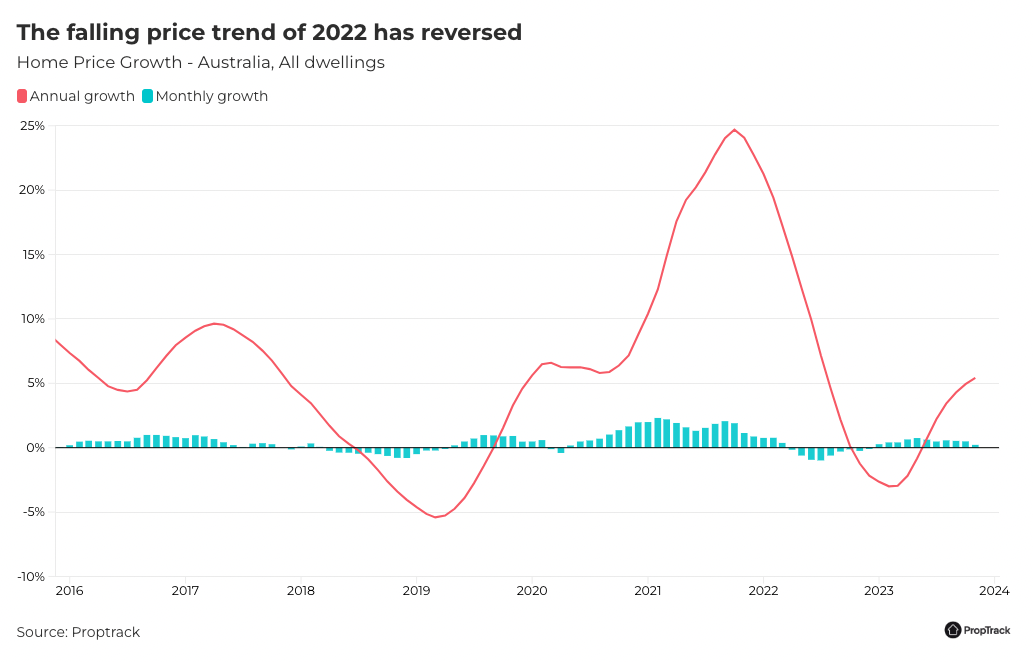
Property prices are continuing to defy expectations across the country, and while the pace of growth has started to slow, prices are still rising much faster than in 2022.
The latest PropTrack Home Price Index shows prices have grown every month of this year, remaining resilient in the face of higher interest rates.
However, the pace of growth has slowed in recent months with the increase in properties coming to market giving buyers more choice and affordability remaining stretched.
In the year to November 2022 national home prices were still falling, sliding 1.23% from their previous peak in March 2022 and eventually hitting a low point in December 2022.
After falling for 9 straight months, prices slipped 4.02% from peak to trough.
This year has been very different, despite interest rates continuing to climb higher in February, March, May, June and November.
Strong housing demand, buoyed by record net overseas migration, tight rental markets, low unemployment and home equity gains, has worked alongside limited housing stock to offset the impacts of higher interest rates this year.
National prices are now up 5.53% from the low point recorded in December 2022. This brings them 1.29% above their previous peak recorded in March 2022 to a fresh record high.
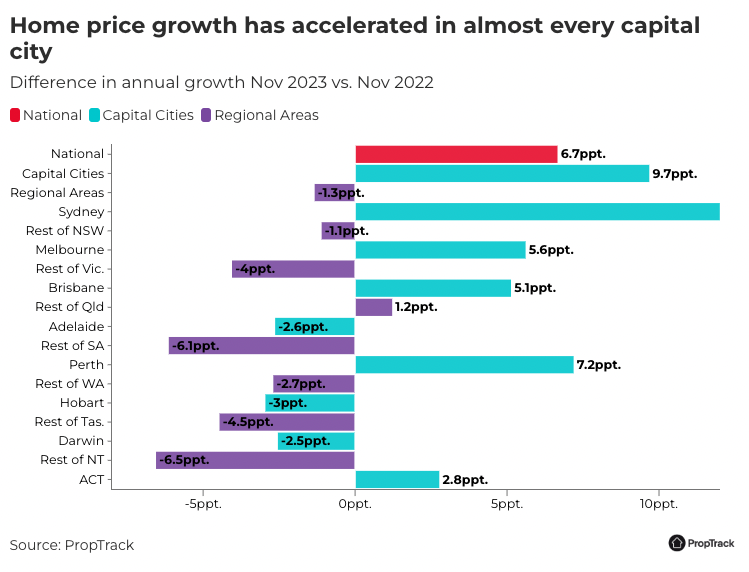
Price growth has accelerated in almost every capital city market relative to the same period in 2022, although regional areas are seeing slower growth with the exception of regional Queensland.
In 2022 regional areas were outperforming capital cities, and for much of 2022 when interest rates were first rising at a fast pace prices held up better in the regions.
However, capital city markets have led the price upturn in 2023 while regional areas have had slower growth, leading to a reversal of the regional outperformance seen in 2022.
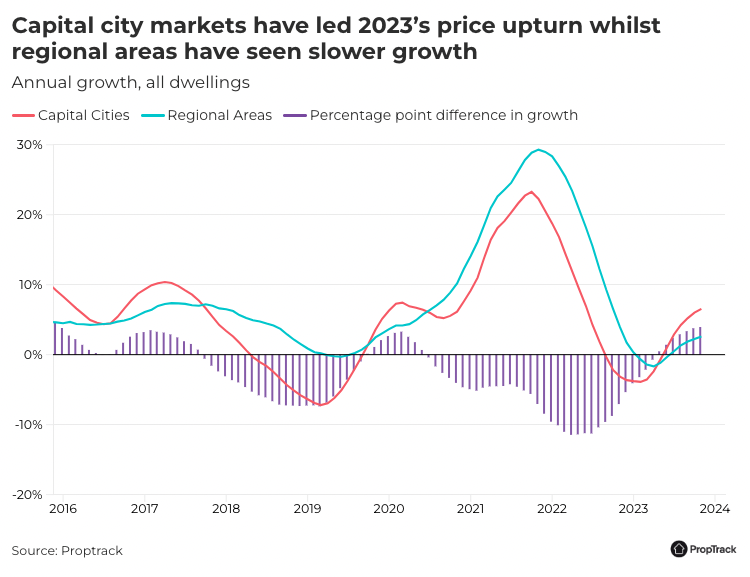
The pace of growth in regional markets has begun to increase after lagging much of this year and in November, regional prices rose 0.12% to set a fresh record high.
Despite the pace of growth beginning to increase capital city markets continued their stretch of outperformance and prices in the combined capital cities also set a fresh record high climbing 0.26% month-on-month.
Capital city markets, with the exception of Adelaide and Hobart have outperformed their regional counterparts on an annual basis in every state in the 12 months to November.

Out of the capitals Sydney and Brisbane led the turnaround and have completely recovered from the fast falls of 2022, with both markets hitting fresh price peaks in November. Although the recovery is lagging in Melbourne, Hobart, and Canberra, home price growth has accelerated relative to earlier in the year.
Prices didn’t fall in 2022 in Adelaide and Perth, but growth accelerated as the falling price trend reversed in other markets and stock listed for sale remained very limited.
Prices hit fresh peaks in each of these markets in November and they remain the strongest capital city markets over the past year. Limited supply amid strong buyer demand has resulted in a sellers’ market with strong competition amongst buyers in both cities whilst the relative affordability of homes, population growth, and very tight rental markets are also supporting values.
With this year’s sustained price rises and stronger homebuying demand environment, market conditions are firmer and both buyer and seller confidence is up relative to the same time in 2022.
Improved confidence and stronger market conditions have translated into stronger selling activity.
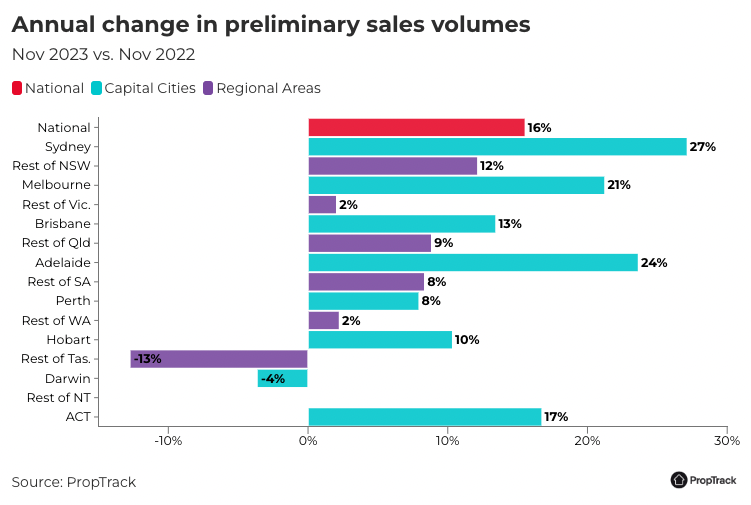
In November 2023 preliminary sales volumes increased 16% relative to the same period in 2022. This has been led by a strong increase in Sydney where preliminary monthly sales were 27% higher than levels seen in November 2022.
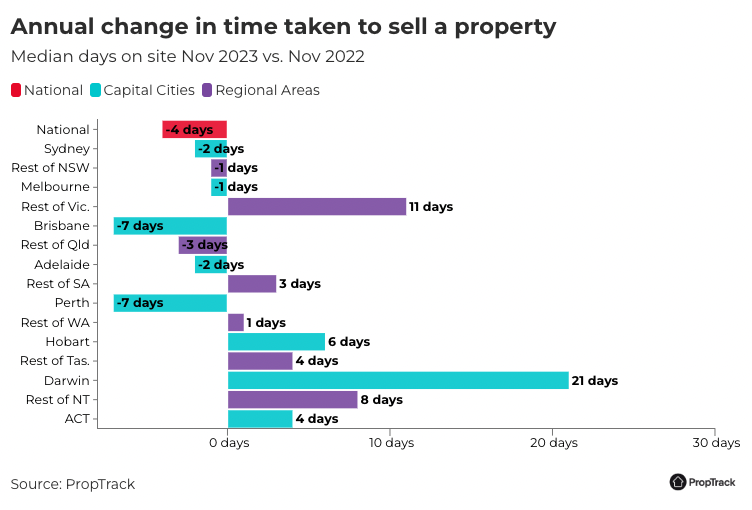
Properties are also taking less time to sell with the stronger homebuying demand environment in play.
The median number of days properties are advertised on realestate.com.au has fallen from 40 days a year ago to 36 days, despite the increase in stock for sale relative to November 2022. In each of the major capital cities, properties are now selling faster than they were a year ago.
Although the number of first- home buyers purchasing is well below the highs experienced during the pandemic, first- home buyer activity has lifted throughout 2023 and is above its long-term average.
Challenging conditions in rental markets right around the country have likely incentivised those with the means to purchase sooner than they otherwise would have.
With rental markets expected to remain tight this is likely to continue in 2024, especially as mortgage rates stabilise.
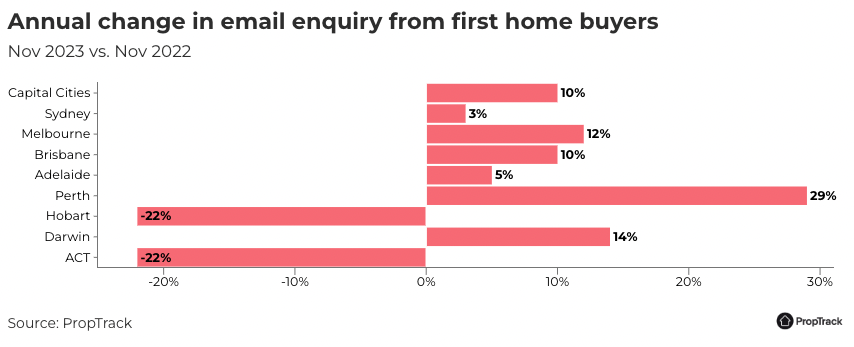
Enquiry from those identifying as first home buyers on properties listed for sale on realestate.com.au has also increased, climbing 10% year-on-year across the capital cities in November 2023.
Activity from investors has also stabilised with investor lending having returned to comprising around a third of new credit, after falling to approximately a quarter through the pandemic.
Although we continue to see a heightened volume of investor-owned properties listed for sale - indicating some investors are exiting the market - we have also seen new investors enter the market with an increase in investor-owned properties listed for rent.
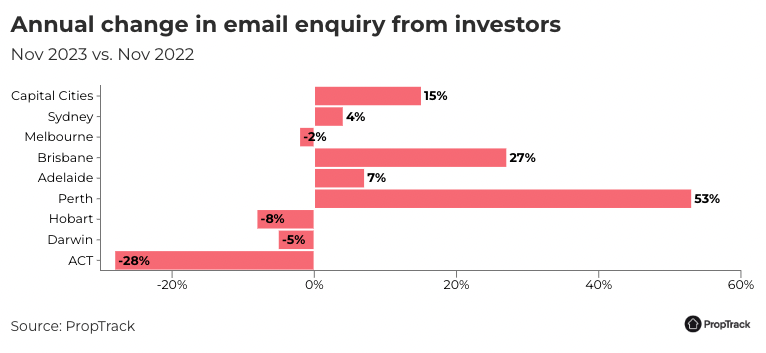
Enquiry from those identifying as investors on properties listed for sale on realestate.com.au has also increased, climbing 15% year-on-year across the capital cities in November 2023.