The property market had a busy start to spring with new listings sitting 4.5% higher year-on-year.
Executive summary
The number of homes hitting the market picked up compared to 12 months ago, with new for sale listings sitting 4.5% higher year-on-year in September.
Despite the overall rise, there are significant differences by state. Australia’s three most expensive capital cities – Sydney, Melbourne and Canberra – have seen the highest year-on-year growth in new listings.
Property markets saw more homes hit the market in September compared to a year ago. Picture: Getty
Selling activity has picked up the most in Greater Sydney, with new listings up 21.3% year-on-year. Melbourne and Canberra followed, with new listings up 10.1% and 4.9% respectively.
Perth, in contrast, saw new listings fall 12.8% year-on-year, the largest drop of any capital city. The only other cities to see a decline in new listings over the past 12 months were Darwin, down 11.3%, and Brisbane, down 4.2%.
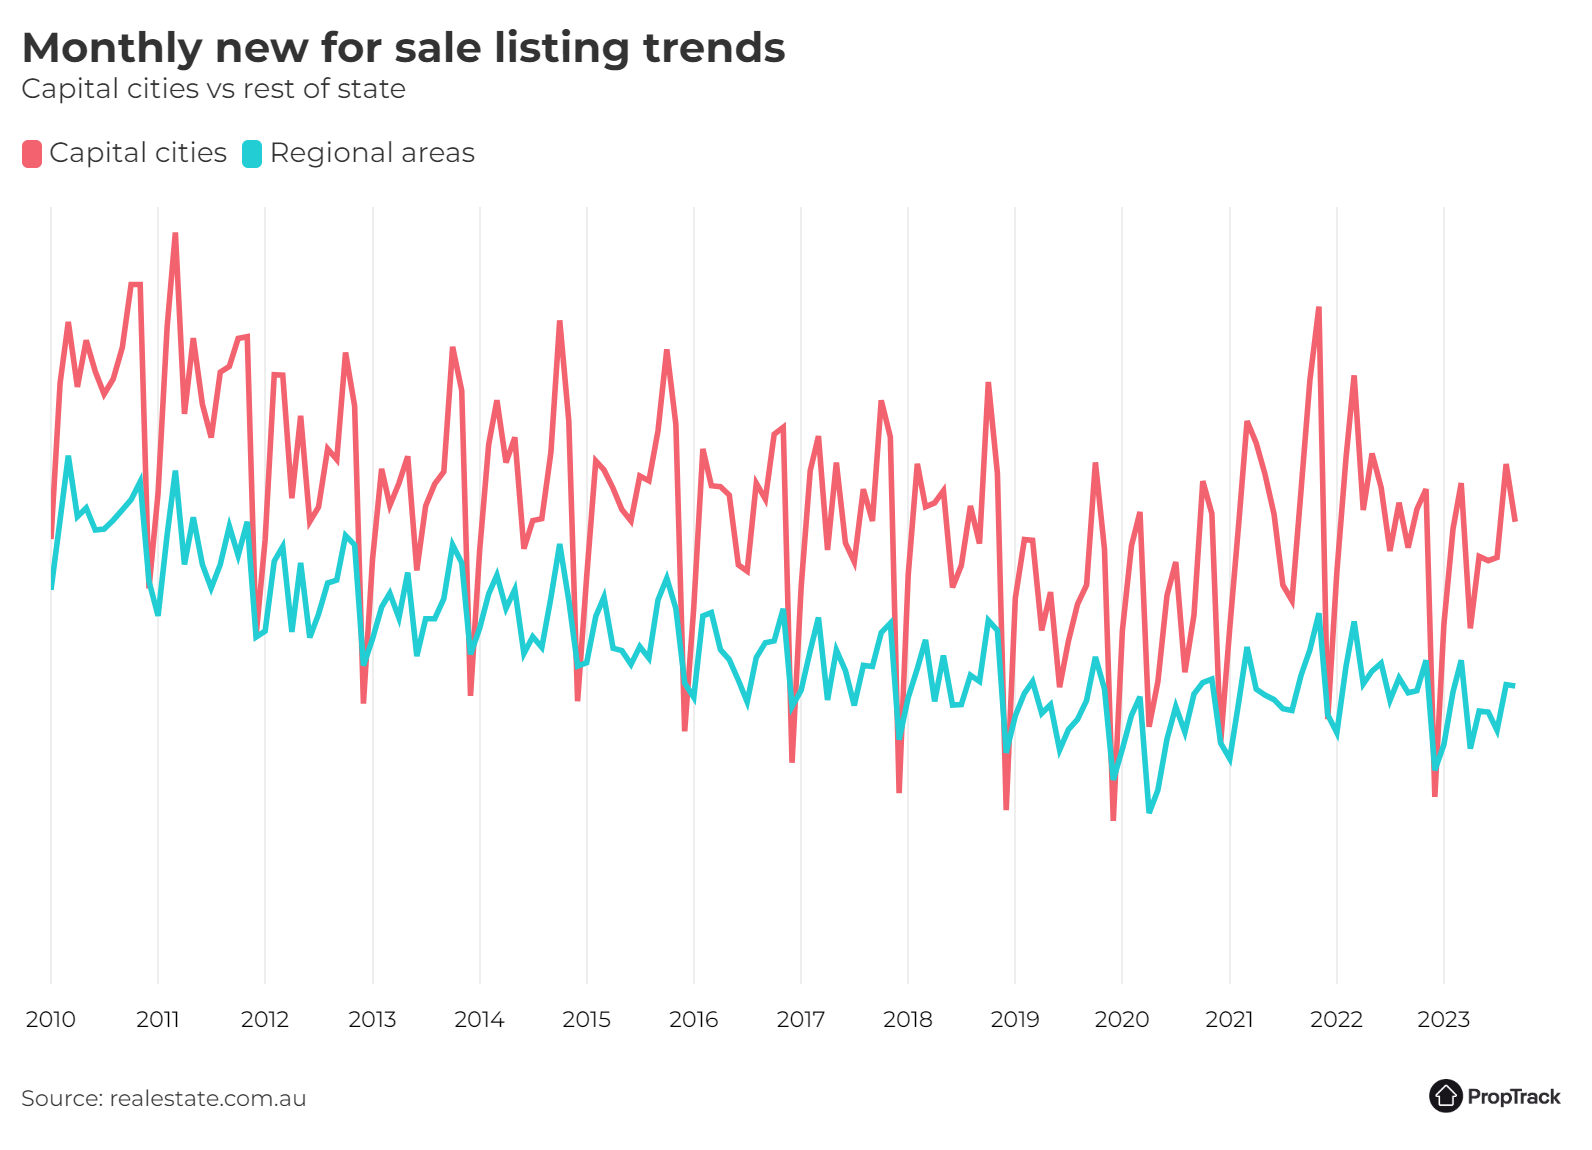
The number of new listings across Australia’s combined capital cities was 5.9% higher in September of this year compared to last, while combined regional areas saw new listings up 2.3% over the same 12-month period.
An improvement in seller sentiment has been a key driver behind the annual rise in the number of new listings. This time last year, sentiment among both buyers and sellers was falling, with the market in the midst of one of the most aggressive series of interest rate hikes ever undertaken by the Reserve Bank.
Interest rates are now largely predicted to have reached their peak, having held steady since July. This has supported a recovery in sentiment which, according to realestate.com.au’s Residential Audience Pulse, has recorded a significant jump from the start of the year.
While they were up annually, national new listings were down 7.1% month-on-month. Capital cities drove the decline, recording an 11% drop in new listings in September compared to August, while regional areas held relatively steady, dipping just 0.3%.
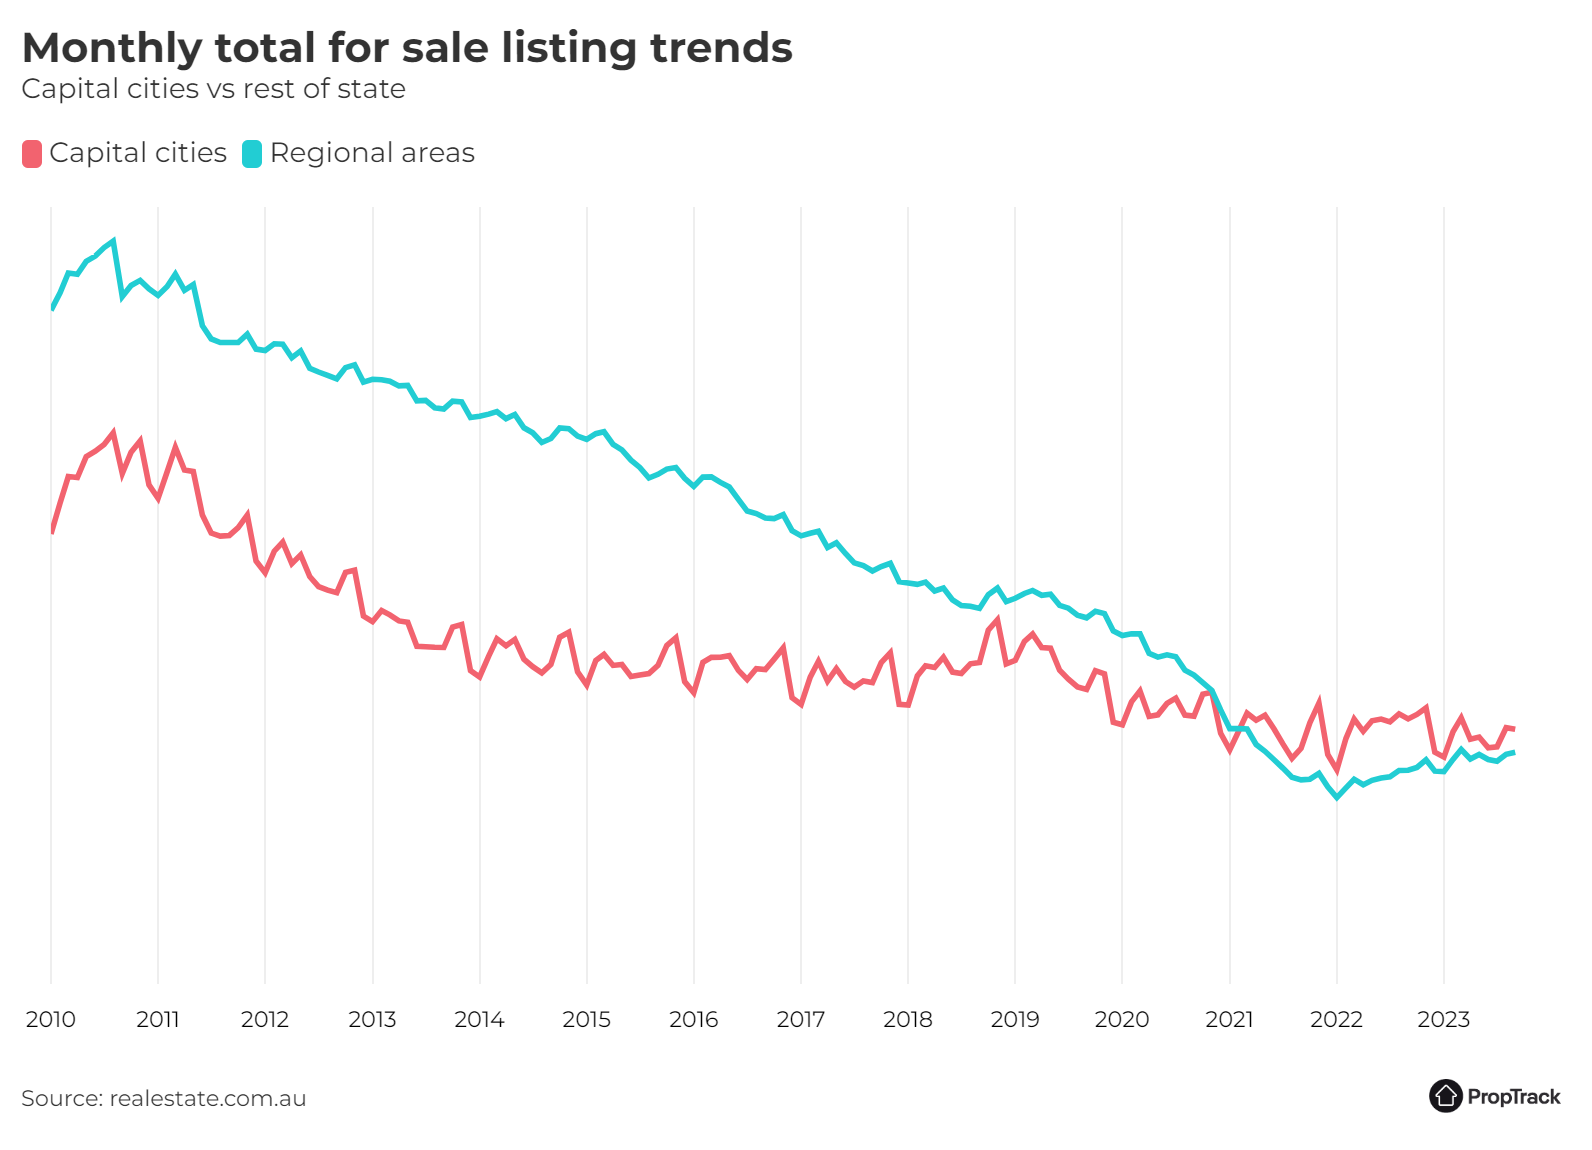
Despite the monthly fall in new listings, total listings held relatively steady, rising by 0.8% month-on-month. This is likely a result of the high number of properties listed in August, many of which were still on the market in September.
With more homes for sale, this provided more choice for buyers and helped to alleviate the pressure to bid early to avoid missing out.
Where to from here?
While spring is typically the most popular time of year to sell a property, it isn’t uncommon for fewer new listings to be seen in September compared to August, with this occurring during five of the past 10 years. Factors dampening selling activity in September were the school holidays, the AFL Grand Final long weekend in Victoria and the Labour Day long weekend in a number of states.
October, in contrast, has consistently recorded a monthly increase in new for sale listings over each of the past 10 years, an outcome that is expected to be repeated this year. In addition to the seasonal impact, listings volumes will be supported by strong selling conditions in most markets.
Property prices have climbed every month in 2023, recovering last year’s falls to reach a new peak in September. What’s more, the outlook for the property market remains strong. Interest rates are likely at, or very close to, peak levels, and Australia’s population is growing at close to record speeds which is driving increased demand for housing.
New listings activity in Sydney slowed in September, yet remained significantly higher compared to the same time last year.
While the number of homes newly listed for sale in Greater Sydney dipped by 10.8% between August and September, there were 21.3% more new listings compared to the same time last year.
For buyers, the year-on-year rise in new listings is good news, providing more choice, and helping to alleviate the high levels of competition seen when supply was more limited.
In contrast to Greater Sydney, regional NSW saw more homes up for sale in September, with new listings rising 4.3%. Across regional NSW, there were 9.9% more new listings in September compared to 12 months ago.
Turning to total listings, both Greater Sydney and regional NSW saw more homes for sale in September compared to any other month this year.
For Greater Sydney, total listings in September were at the highest levels seen since September last year and up 2.2% over the month.
Total listings in regional NSW rose 4.4% over September to reach the highest level seen in close to three years.
Victoria
New listings in Melbourne were up in September compared to the same time last year as activity picked up for spring.
The number of homes newly listed for sale dropped by 15.1% between August and September, with selling activity dampened by the school holidays and the AFL Grand Final long weekend.
Despite the drop, selling activity has picked up from last year’s levels, with new listings up 10.1% in Greater Melbourne compared to 12 months ago.
New listings in regional Victoria recorded a similar year-on-year rise, up 10.9% over the 12 months to September.
Total listings were up slightly over September, rising by 0.3% in Greater Melbourne, and 2.1% in regional Victoria.
Buyers across Victoria enjoyed more choice in September compared to the same time last year. Total listings in Greater Melbourne were up 7.4% year-on-year, while those in regional Victoria were a whopping 37.6% higher.
The rise in regional listings in particular is good news for buyers. The pandemic years drove record demand for regional property which resulted in an intensely competitive market. Increased supply has aided in cooling demand, with prices in regional Victoria falling 0.2% over September, one of the only markets to record a decline.
Queensland
The supply of homes for sale remained tight in Queensland, with fewer new listings compared to 12 months ago.
Queensland saw fewer homes for sale in September, with new listings down both over the month and the year.
The number of homes newly listed for sale in Greater Brisbane was 7.3% lower in September compared to August, while regional Queensland saw new listings down 6.6% over the month.
Year-on-year, the number of new listings in Greater Brisbane and regional Queensland fell by 4.2% and 8.5%, respectively.
Total listings have seen an even greater decline over the past 12 months, sitting 14% lower in Greater Brisbane and 10.3% lower in regional Queensland.
With fewer options, competition among buyers remain high, and those homes that hit the market are selling fast. In September, the median time taken for a property to sell fell to the lowest level seen in 18 months.
Restrained supply amid strong buyer demand is also supporting prices which, over the 12 months ending September, grew by 5.8% in Greater Brisbane and 4.9% in regional Queensland.
South Australia
Selling activity slowed in Adelaide over September, however the total number of homes hitting the market has picked up slightly from 12 months ago.
There were 5.5% fewer new listings in Greater Adelaide over September, following a strong rise in August. Compared to 12 months ago, new for sale listings were 2.1% higher.
While new listings in Greater Adelaide were lower over September, total listings held steady over the month, falling by just 0.1%.
In regional SA, the number of new listings continued to rise over September, recording growth of 4.7% over the month. This brought new for sale listings in regional SA to the highest level seen since March 2022.
Buyers in regional SA enjoyed more choice in September compared to 12 months ago, with the total number of homes listed for sale up 7.6%.
Western Australia
Buyers in Perth faced less choice in September, with the number of homes newly listed for sale subdued.
The number of homes newly listed for sale in Greater Perth fell by 9.2% between August and September and was down 12.8% year-on-year.
With supply limited and buyer demand strong, those properties that are hitting the market are performing well and, in September, the median time taken to sell fell to the lowest level seen in over five years.
Fewer new listings and faster selling times have driven total for sale listings lower, and there were 25.7% fewer homes listed for sale in September of this year compared to last.
Limited supply amid strong buyer demand has resulted in a strong sellers’ market, with the median home price in Greater Perth rising by 0.7% over September, the highest growth seen in any capital city over the month.
In contrast to Greater Perth, regional WA saw new listings increase over September, up 4.1% over the month and 1.3% over the year.
But despite the rise in new listings, strong buyer demand has seen properties selling faster, resulting in the total number of homes for sale in September sitting 10.9% lower year-on-year.
Tasmania
Hobart was the only capital city to see the number of new listings increase over September.
Across Greater Hobart there were 1.6% more new listings in September compared to August, 0.7% more compared to 12 months ago.
While these increases are modest, Greater Hobart’s property market has cooled considerably over the past 12 months, and this has led to a significant jump in the average time taken to sell a property. As a result, the total number of homes listed for sale has risen substantially, sitting 25.7% higher compared to 12 months ago.
For buyers, this is great news, with prices moderating, more choice, and less competition compared to a year ago.
The trend has been similar in regional Tasmania. While new listings declined by 3.2% over the month and 3.0% over the year, the total number of properties listed for sale was 30.7% higher in September compared to the same time last year.
Northern Territory
Selling activity in Darwin saw a slight slow-down in September, with fewer new listings compared to a year ago.
Across Darwin, the number of homes newly listed for sale declined by 4.3% over September, corresponding to an 11.3% fall year-on-year.
Buyers in Darwin are in a stronger position compared to 12 months ago, with median home prices sitting 1.6% lower, and properties taking longer to sell. Longer sale times, in particular, are providing more choice to buyers, with the total number of homes listed for sale 4.9% higher in September compared to 12 months earlier.
Buyers in regional NT are benefiting from more choice, with the number of homes newly listed for sale in regional NT increasing by 4.8% over the month and 41.9% year-on-year.
However, listings activity in regional NT can be volatile as it is a small market with relatively little activity each month.
Australian Capital Territory
The number of new listings in Canberra slowed in September following an exceptionally busy August.
After a bumper August, which saw the highest number of homes hit the market in Canberra since March 2022, new listings slowed in September.
New for sale listings fell 14.4% over the month, though were up 4.9% year-on-year.
Despite new listings falling over September, the total number of homes listed for sale increased, due to spill over from the high volume of properties listed in August that were still yet to sell. In addition, properties are taking longer to sell in Canberra, with the median sale time steadily rising over the past 18 months. As a result, the total number of homes listed for sale in September was 15.5% higher compared to 12 months ago.
Methodology
The ‘PropTrack Listings Report’ details monthly changes in the number of properties listed for sale on realestate.com.au. The listings are split into ‘new’ and ‘total’ listings.
New listings consist of properties that were newly listed for sale on realestate.com.au within the reported month.
Total listings is the total supply of properties for sale in the reported month. It consists of all listings which were for sale during that month (including new listings) irrespective of the date they first appeared on site.
The geographical areas described in this report are based on the Greater Capital City Statistical Area (GCCSA) as defined by the Australian Bureau of Statistics.
Disclaimer: PropTrack Listings Report is summary information only. realestate.com.au Pty Limited [REA] makes no representation whatsoever about PropTrack Listings Report’s completeness or accuracy. REA is under no obligation to update or correct any of the PropTrack Listings Report data or to continue to make the PropTrack Listings Report available. REA recommends that any users of the PropTrack Listings Report exercise their own skill and care with respect to their use of the PropTrack Listings Report and that users carefully evaluate the accuracy, currency, completeness and relevance of the PropTrack Listings Report for their purposes. REA expressly bears no responsibility, and accepts no liability, whatsoever for any reliance placed by you or others on the PropTrack Listings Report, or from any use of the PropTrack Listings Report by you or others. If you wish to cite or refer to this report (or any findings or data contained in it) in any publication, please refer to the report as the ‘PropTrack Listings Report – September 2023′.