Sellers in prime winter position as supply remains limited amid solid demand.
Activity in property markets was a little quieter in June than in May, as the autumn selling season ended and the usually quieter winter period started. However, the decline in activity was smaller than is typically the case, with some markets, like Sydney, even seeing a small increase in activity. Even so, the 2023 trend of slower property market activity continued, with all capitals seeing fewer new listings this June than last year.
Buyers faced slightly less overall choice in June, with the total number of properties available for sale across the country declining 2.5% compared to May. However, the story is different across the different regions. In Sydney and Melbourne, the total number of properties available for sale is down from where it was a year ago but is only a little below the average over the previous decade. In regional NSW and Victoria, choice has improved markedly compared to a year ago. In contrast, buyers in Perth are facing a record low number of properties on market.
Buyers across the country faced less choice in June as total listings fell 2.5% compared to May. Picture: Getty
This monthly report analyses new and total listings on realestate.com.au to provide the most up-to-date view on property market supply trends.
Executive summary
Property market activity was a little slower nationally in June for the start of the typically quieter winter period.
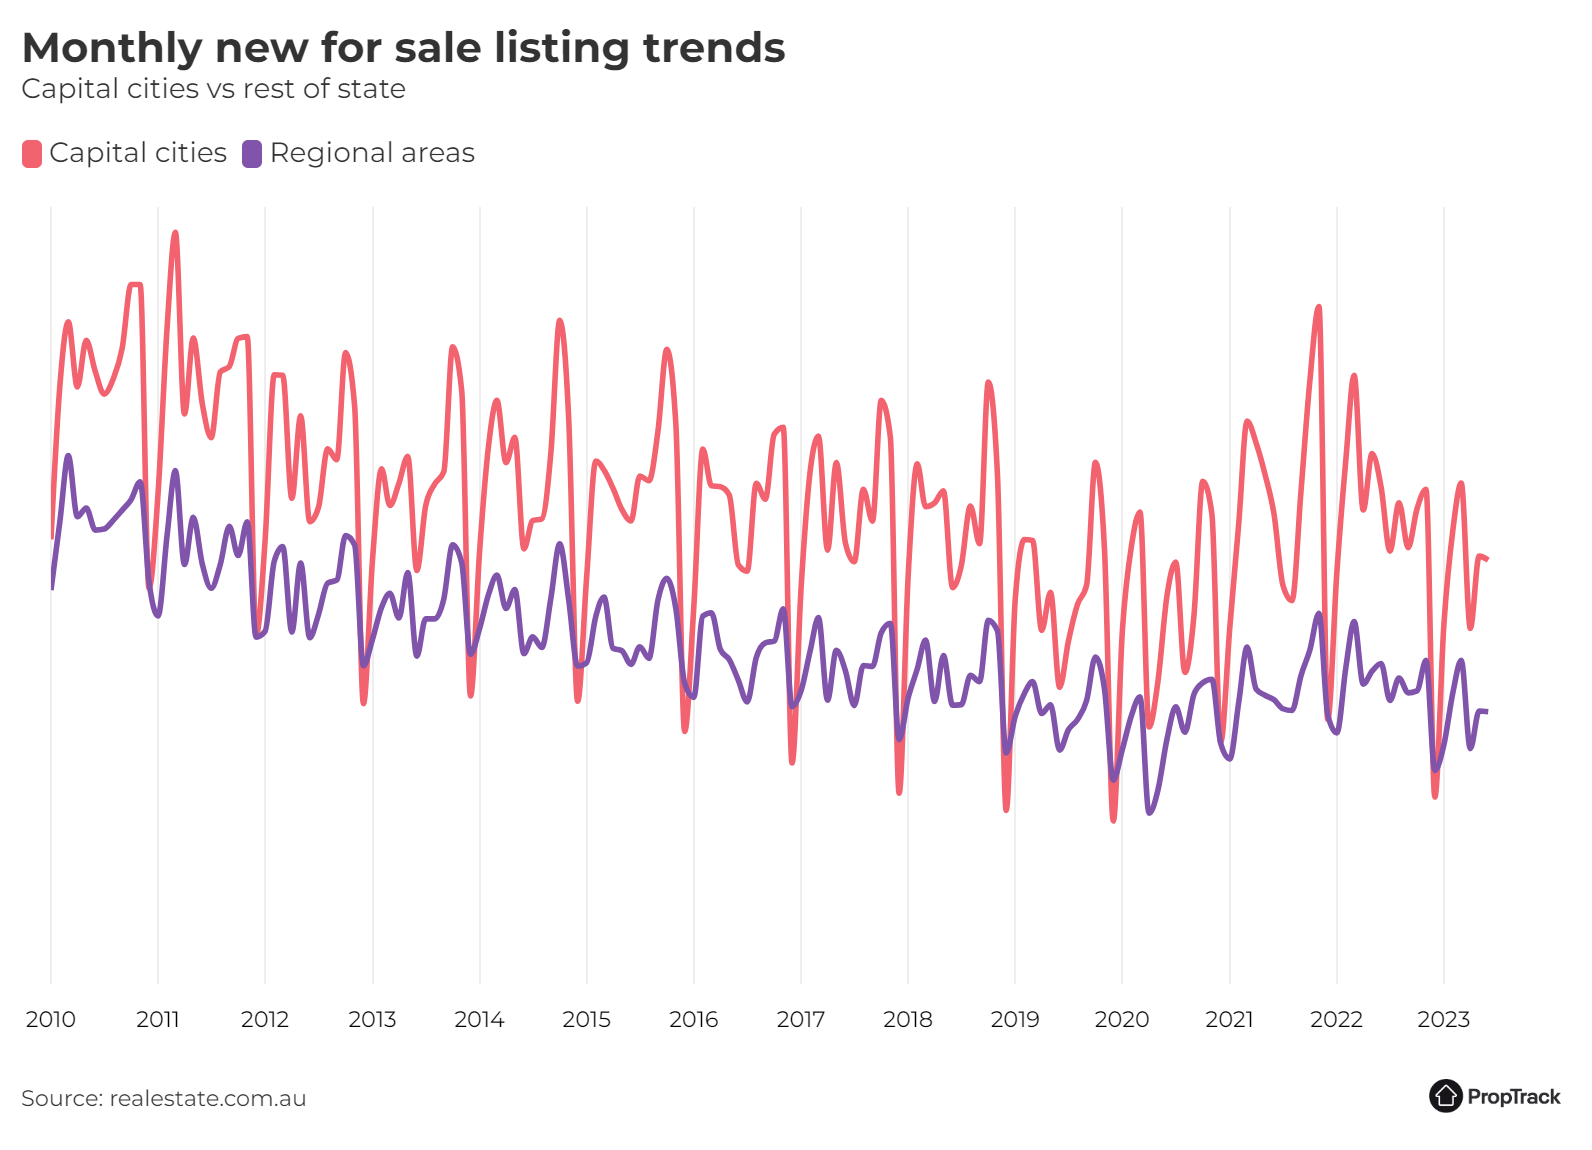
Nationally, new listings on realestate.com.au declined slightly in June compared to May, down 0.7% month-on-month. As has been the case throughout 2023 so far, activity this year has not kept pace with 2022, with new listings in June this year 14.8% lower than at the same time last year.
New listings declined across the combined capital cities, though the decline was more modest than typically seen in June. June typically sees fewer new listings than May, as it is a quieter month following the end of the autumn selling season and is usually the quietest month of winter. Across the capital cities, new listings were down 0.9% month-on-month. Even despite the smaller-than-typical month-on-month decline, new listings were still lower than at the same time a year ago (down 14.6% year-on-year).
Both Sydney and Melbourne continued their quieter 2023 relative to 2022, with fewer new listings in June compared to the same time a year ago. New listings were down 9.2% year-on-year in Sydney and 6.5 year-on-year in Melbourne. While quieter, June represented the smallest year-on-year decline for new listings in both cities since August 2022.
Regional areas also saw slightly fewer new listings in June compared to May, though as in capital cities, activity did not keep pace with last year. New listings regionally were down 15% year-on-year in May.
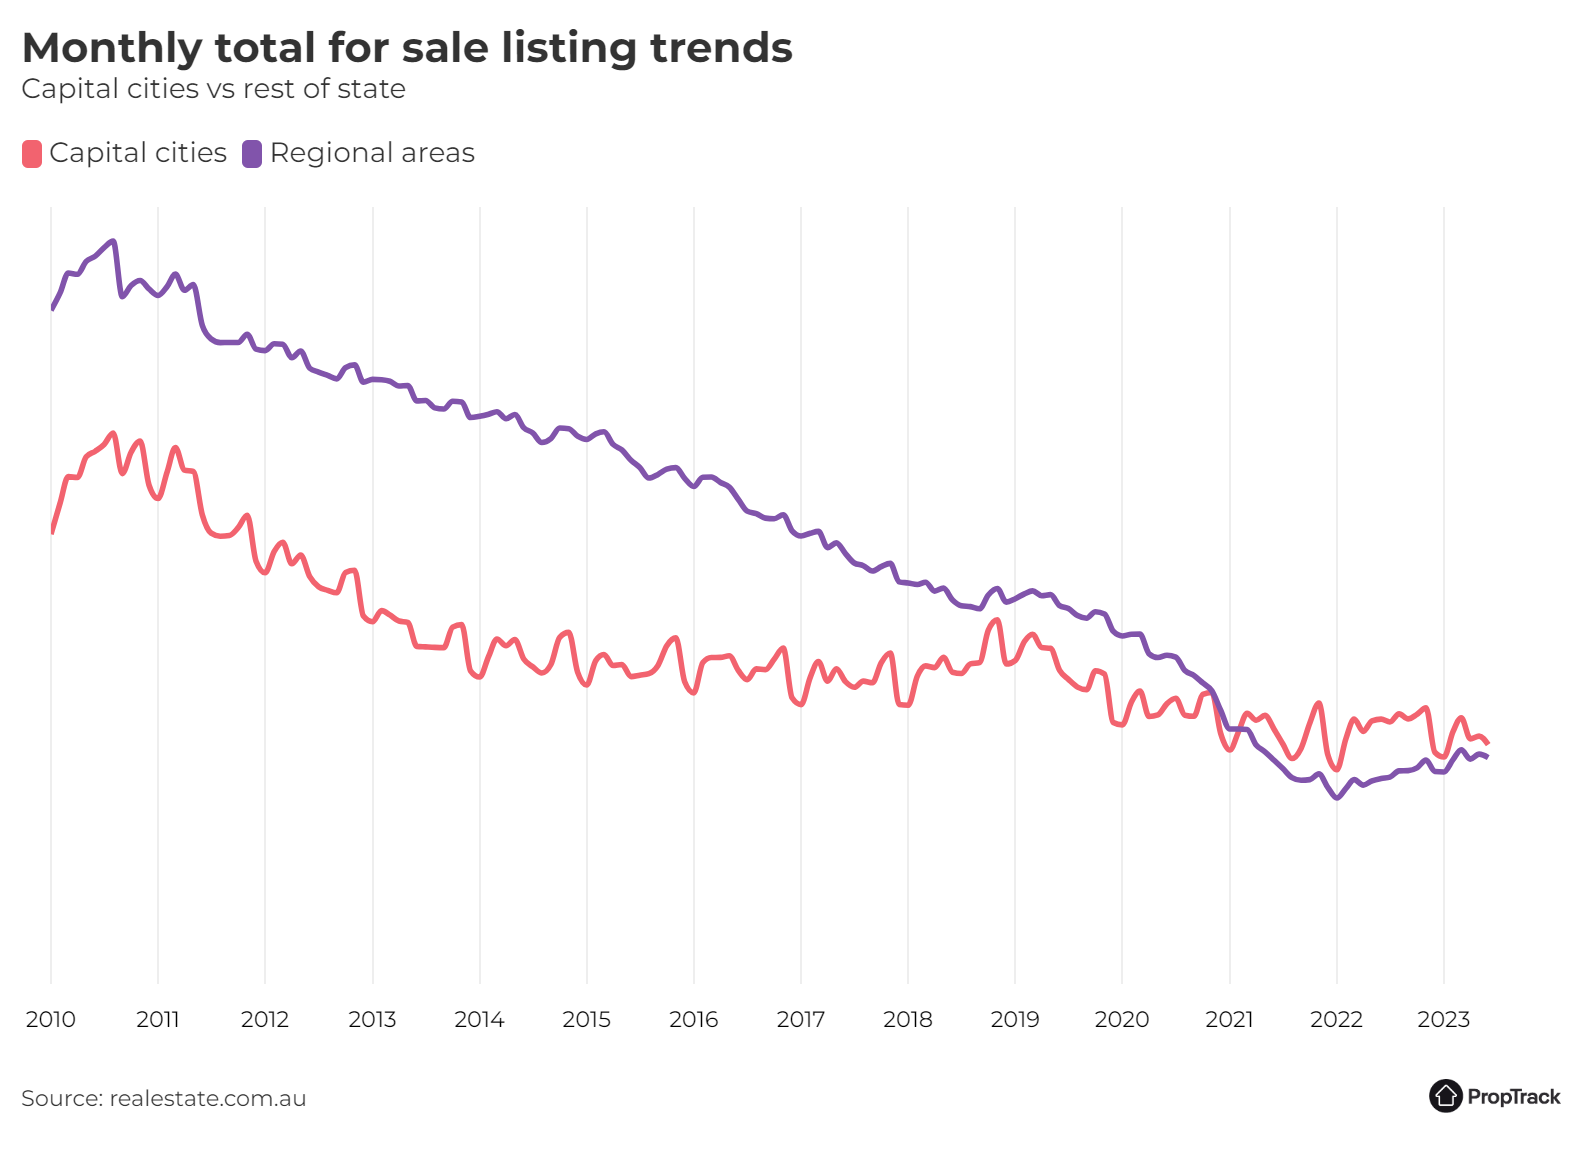
The total number of properties listed for sale across Australia in June declined compared to May, down 2.5% month-on-month. That meant choice for buyers was marginally tighter than a year ago, with the total number of properties listed for sale in June down 1% year-on-year.
Much of the decline in total listings compared to a year ago has been driven by capital cities, particularly Perth, Sydney and to some extent Brisbane. Across the combined capital cities, the total number of properties listed for sale was 9.6% lower than a year ago.
Buyers in Perth are facing particularly restricted options, with the total number of properties listed for sale at a record low in June. While buyers in Sydney and Melbourne have less choice than they did a year ago, this is in part due to the strength in the market in 2022. Relative to the average over the previous decade, the total number of properties listed for sale in Sydney is only down around 6%. In Melbourne, it is only down around 2%.
In contrast, buyers looking in regional areas have seen an improvement in choice compared to a year ago, especially in regional Victoria and regional NSW. Both regions have seen a substantial increase in the total number of properties listed for sale in June relative to a year ago, after a period of severely limited options during the pandemic.
Where to from here?
The first half of 2023 has been quieter than was the case in 2022 for property markets across the country. Activity is likely to be a little slower over the next couple of months during the typically quieter winter period, before activity starts to pick up again for the spring selling season, and the usual seasonal peak of activity in October and November.
Selling conditions have improved compared to the second half of 2022. Auction clearance rates have picked up noticeably compared to late last year and have remained solid throughout autumn and into the start of winter. Home prices are also recovering after the downturn last year and increased in June for the sixth consecutive month. Prices are now up 2.3% since December – a notable change from the price falls seen throughout much of 2022 when the RBA was raising interest rates rapidly.
Further out, the fundamentals of housing demand remain strong. Rental markets are extremely tight across much of the country amid strong demand and limited rental availability. Unemployment is still sitting close to a five-decade low and labour demand has moderated only a little. Wages growth has picked up, and there are signs the peak of inflation is behind us. Interest rates are also near their peak. International migration has also resumed, which will further add to housing demand.
How listings are faring across Australia
New South Wales
Sydney’s property market had a slightly busier June, bucking the usual seasonal trend of a quieter start to winter.
Property markets in Sydney were slightly busier in June than in May, with 1.2% more new listings month-on-month. While only a small increase, it is a little unusual as June is usually a quieter month than May following the end of the autumn selling season (and, historically, the quietest month of winter).
Even so, activity was slower than a year ago, as it has been since spring last year. New listings were down 9.2% compared to a year earlier. While still a slower pace than a year ago, it was the smallest year-on-year decline since August 2022.
Choice for buyers declined during the month, with the total number of properties decreasing 3.1% month-on-month in June. After a number of months with fewer properties hitting the market, the total number of properties available for sale is quite a bit lower than a year ago, down 15% compared to June 2022 (though supply was quite high at that point).
Regional NSW saw a small decline in property market activity in June, with the number of new listings decreasing 1.2% month-on-month. As with Sydney, conditions remain slower than a year ago, with new listings down 15.2% year-on-year.
The good news for regional buyers is that there has been a substantial improvement in choice over the past 18 months after a period of extremely restricted options during the pandemic. Compared to a year ago, the total number of properties available for sale in regional NSW was up 22.1%,in June, though it did slide in the month (down 2.8% month-on-month).
Victoria
Activity in Melbourne’s property market was marginally slower in June, for what is typically the quietest winter month.
June saw fewer new listings in Melbourne’s property market than in May, consistent with June being the quietest winter month for property market activity. New listings were down 1.4% month-on-month. However, this was a modest decline and smaller than is typical for June.
Despite the smaller-than-typical fall compared to May, June this year remains slower than the same time last year, with new listings down 6.5% year-on-year. However, that represented the smallest year-on-year fall for new listings in Melbourne since August 2022.
The slower winter month meant there was less choice for buyers in Melbourne, with the total number of properties listed for sale declining 4% month-on-month in June. Even so, it remains only marginally below the average over the past decade.
Property markets in regional Victoria had a similarly quieter June, with new listings down 4.4% compared to May and down 6.2% compared to a year ago.
The good news for regional buyers is that choice has been improving for the past 12-18 months and is substantially better than it was in 2021. The total number of properties listed for sale in June was up 39.5% compared to a year ago, despite declining a little in June amid the quieter winter month (-1.6% month-on-month).
Queensland
While June was slightly busier than May, Brisbane’s property market continued to be quieter than the pace seen in 2022.
June saw a modest increase in activity in Brisbane’s property market, with 6% more new listings than in May. Nonetheless, activity was subdued compared to the pace set in 2022, with the number of new listings in June down 23.2% compared to a year ago.
Choice for buyers was largely unchanged in June compared to May, with the total number of properties listed for sale on realestate.com.au increasing 0.1% month-on-month. However, the pick-up wasn’t enough to match last year, and so it was 10% lower compared to a year ago. That means the total number of properties listed for sale across Brisbane is around 40% lower than what has been typical over the past decade.
Regional Queensland also saw activity pick up a bit in June, with 5.8% more new listings than in May. But, like Brisbane, activity in 2023 has not kept pace with the busy market conditions seen in 2022, and new listings were down 20.4% compared to a year ago.
Unfortunately for buyers, choice in regional Queensland remains restricted, with a slight further decline in June (-0.2% month-on-month). That means the total number of properties listed for sale across regional Queensland is down around 45% compared to pre-pandemic levels.
South Australia
Choice for buyers in Adelaide declined in June after a few months of improvement.
June saw a quieter month across Adelaide’s property market, with new listings declining 8.2% compared to May. As has been the case throughout 2023 so far, activity was also slower than a year ago, with new listings down 18.7% year-on-year.
The unfortunate news for buyers in Adelaide is that the total number of properties listed for sale declined 5% in June, after it had improved for a few months. The decline brings the total number of properties available for sale below its February level, and around 40% lower than what has been typical over the past decade.
Regional markets also saw a slightly slower month, with 3.8% fewer new listings in June compared to May.
Choice for buyers remains extremely limited in regional SA. The total number of properties listed for sale fell a little in June after a few months where it had started to improve. Even so, the total number of properties listed for sale was up 3.4% compared to a year ago.
Western Australia
Conditions got even tougher for buyers in Perth, with the total number of properties listed for sale hitting its lowest ever level.
Activity in Perth’s property market slowed a little in June, with 6.7% fewer new listings hitting the market in June compared to May. That means this year was quite a lot slower than last year, with new listings down 25.7% year-on-year.
As has been the case for a while, options are extremely limited for buyers in Perth, with the total number of properties listed hitting a historic low in June, after falling 5.6% compared to May. That means the total number of properties listed for sale across Perth in June was down 20.6% compared to a year ago and is around a third lower than what has been typical over the past decade.
The story was similar in regional WA, with a slightly slower month for new listings in June, down 2.3% from May. Like Perth, activity this year has not kept pace with last year, with new listings in regional WA down 17.2% compared to a year ago.
Tasmania
After a busy start to 2023, momentum has clearly waned in Hobart’s property market.
Unlike other capitals, June was a quieter month across Hobart’s property market, after a busy start to 2023. The number of new listings on realestate.com.au was down 25.5% month-on-month in June and was 22.6% lower than at the same time last year.
New listings activity also slowed in regional Tasmania, with new listings down 15.6% month-on-month in June.
While momentum looks to have faded in Hobart’s property market, the busy past 12-18 months of new properties hitting the market means buyers in Hobart have substantially more choice of properties on market than was the case throughout much of the pandemic. In June, the total number of properties listed for sale in Hobart was 43.3% higher than a year ago, though it was down 7.5% on May. Even so, the number of properties listed for sale across Hobart is only around 6% below its average over the past decade.
Northern Territory
New listings picked up modestly in June in Darwin’s property market, though activity remains slower than last year.
Activity in Darwin’s housing market increased a little June, with 3.6% more new listings than in May. However, as has been the case since spring last year, activity was slower than a year prior, with new listings down 14.4% year-on-year.
Choice for buyers improved further in June, with the total number of properties listed for sale increasing 3.3% compared to May. That continued the trend of improving choice for buyers in Darwin. Compared to a year ago, the total number of properties listed for sale in June was up 5%, lifting it to be 3% higher than pre-pandemic level.
New listings were flat compared to May in regional NT and, like in recent months, were quite a bit higher than at the same time last year (+17.8% year-on-year). However, listings activity in regional NT can be volatile as it is a small market with relatively little activity each month.
Australian Capital Territory
Activity in Canberra’s property market increased modestly in June, but remained slower than a year ago.
June saw an increase in new listings in Canberra’s property market. New listings rose 4.6% month-on-month. Even so, activity in June was not as busy as a year ago, with new listings 12.5% lower than at the same time a year ago.
Buyers in Canberra continued to enjoy more choice than has been typical over the past decade, as they have for much of 2023. The total number of properties listed for sale in June was around 6% higher than what has been typical over the past decade, and up 8.5% compared to a year ago. That said, the total number of properties available for sale did decline in June, falling 5.3% compared to May.
Methodology
The ‘PropTrack Listings Report’ details monthly changes in the number of properties listed for sale on realestate.com.au. The listings are split into ‘new’ and ‘total’ listings.
New listings consist of properties that were newly listed for sale on realestate.com.au within the reported month.
Total listings is the total supply of properties for sale in the reported month. It consists of all listings which were for sale during that month (including new listings) irrespective of the date they first appeared on site.
The geographical areas described in this report are based on the Greater Capital City Statistical Area (GCCSA) as defined by the Australian Bureau of Statistics.
Disclaimer: PropTrack Listings Report is summary information only. realestate.com.au Pty Limited [REA] makes no representation whatsoever about PropTrack Listings Report’s completeness or accuracy. REA is under no obligation to update or correct any of the PropTrack Listings Report data or to continue to make the PropTrack Listings Report available. REA recommends that any users of the PropTrack Listings Report exercise their own skill and care with respect to their use of the PropTrack Listings Report and that users carefully evaluate the accuracy, currency, completeness and relevance of the PropTrack Listings Report for their purposes. REA expressly bears no responsibility, and accepts no liability, whatsoever for any reliance placed by you or others on the PropTrack Listings Report, or from any use of the PropTrack Listings Report by you or others. If you wish to cite or refer to this report (or any findings or data contained in it) in any publication, please refer to the report as the ‘PropTrack Listings Report – June 2023′.