Property market activity slowed sharply in December, as buyers and sellers took the usual end-of-year break.
Property markets around the country saw quieter new listings activity in December, as they usually do around the end-of-year break. The number of new listings nationally on realestate.com.au was down more than half compared to November. While a large decline, it is consistent with the usual end-of-year dip in December, which is typically the quietest month of the year. Compared to a year ago, new listings activity was up 0.4%.
Activity in both Sydney and Melbourne was quiet amid the usual end-of-year slowdown, with only around a third as many new listings hitting the market in December as in November. Nonetheless, both cities continued to see busier activity this year than they did during 2022. December new listings in Sydney were 17.4% higher than at the same time last year and in Melbourne they were up 18.5% year-on-year.
The same was not true across the other capitals. All but Canberra recorded fewer new listings this December than at the same time last year.
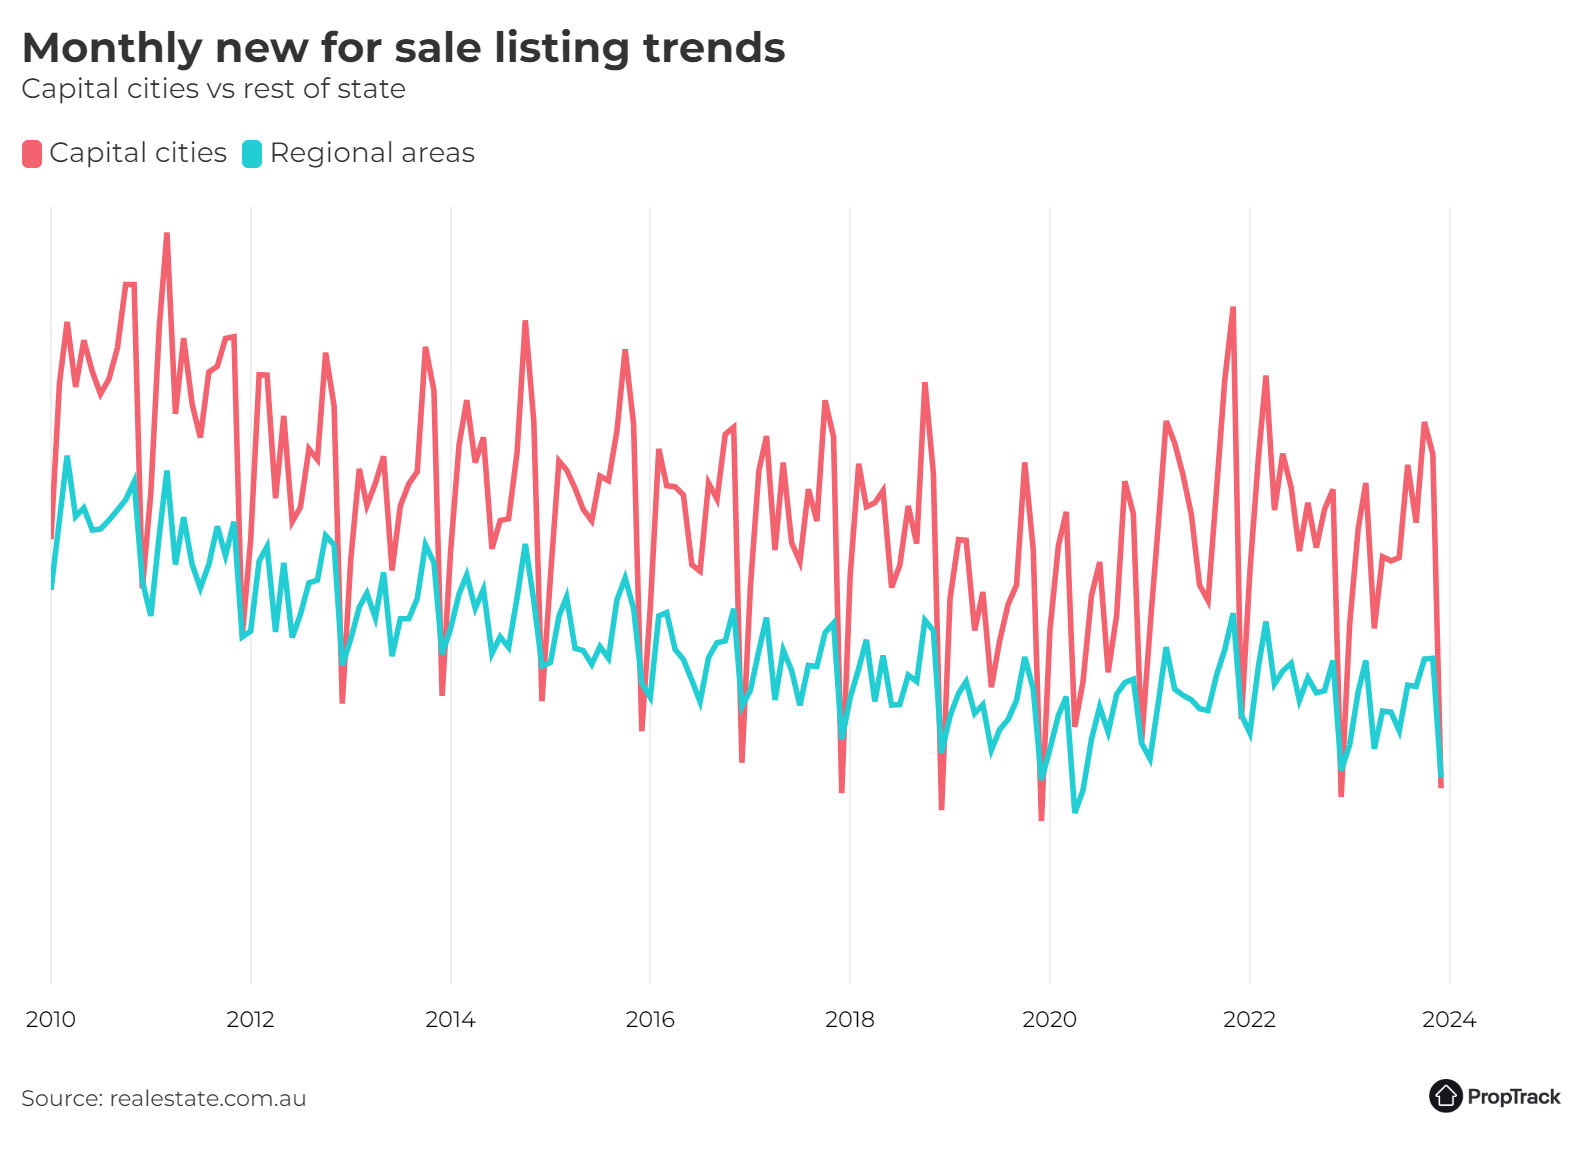
Regional areas also saw activity cool off for the end-of-year break, though the hiatus was not as pronounced regionally as in capital cities. Even so, activity slightly lagged the pace set last year, with 3.4% fewer new listings regionally this year than last. Only regional Victoria (+1.9% year-on-year) and regional Tasmania (+6.5% year-on-year) bucked that trend.
The quieter market conditions meant buyers had less to choose from, with almost all parts of the country recording notable declines in the total number of properties listed for sale in December.
Even so, choice remains healthy in Sydney, Melbourne, Canberra and Hobart. In all but Sydney, the total number of properties listed for sale is above the average over the past decade. In Sydney, while choice declined below the average over the previous decade, it remains reasonably close, particularly given choice is normally lower in December because of the end-of-year break.
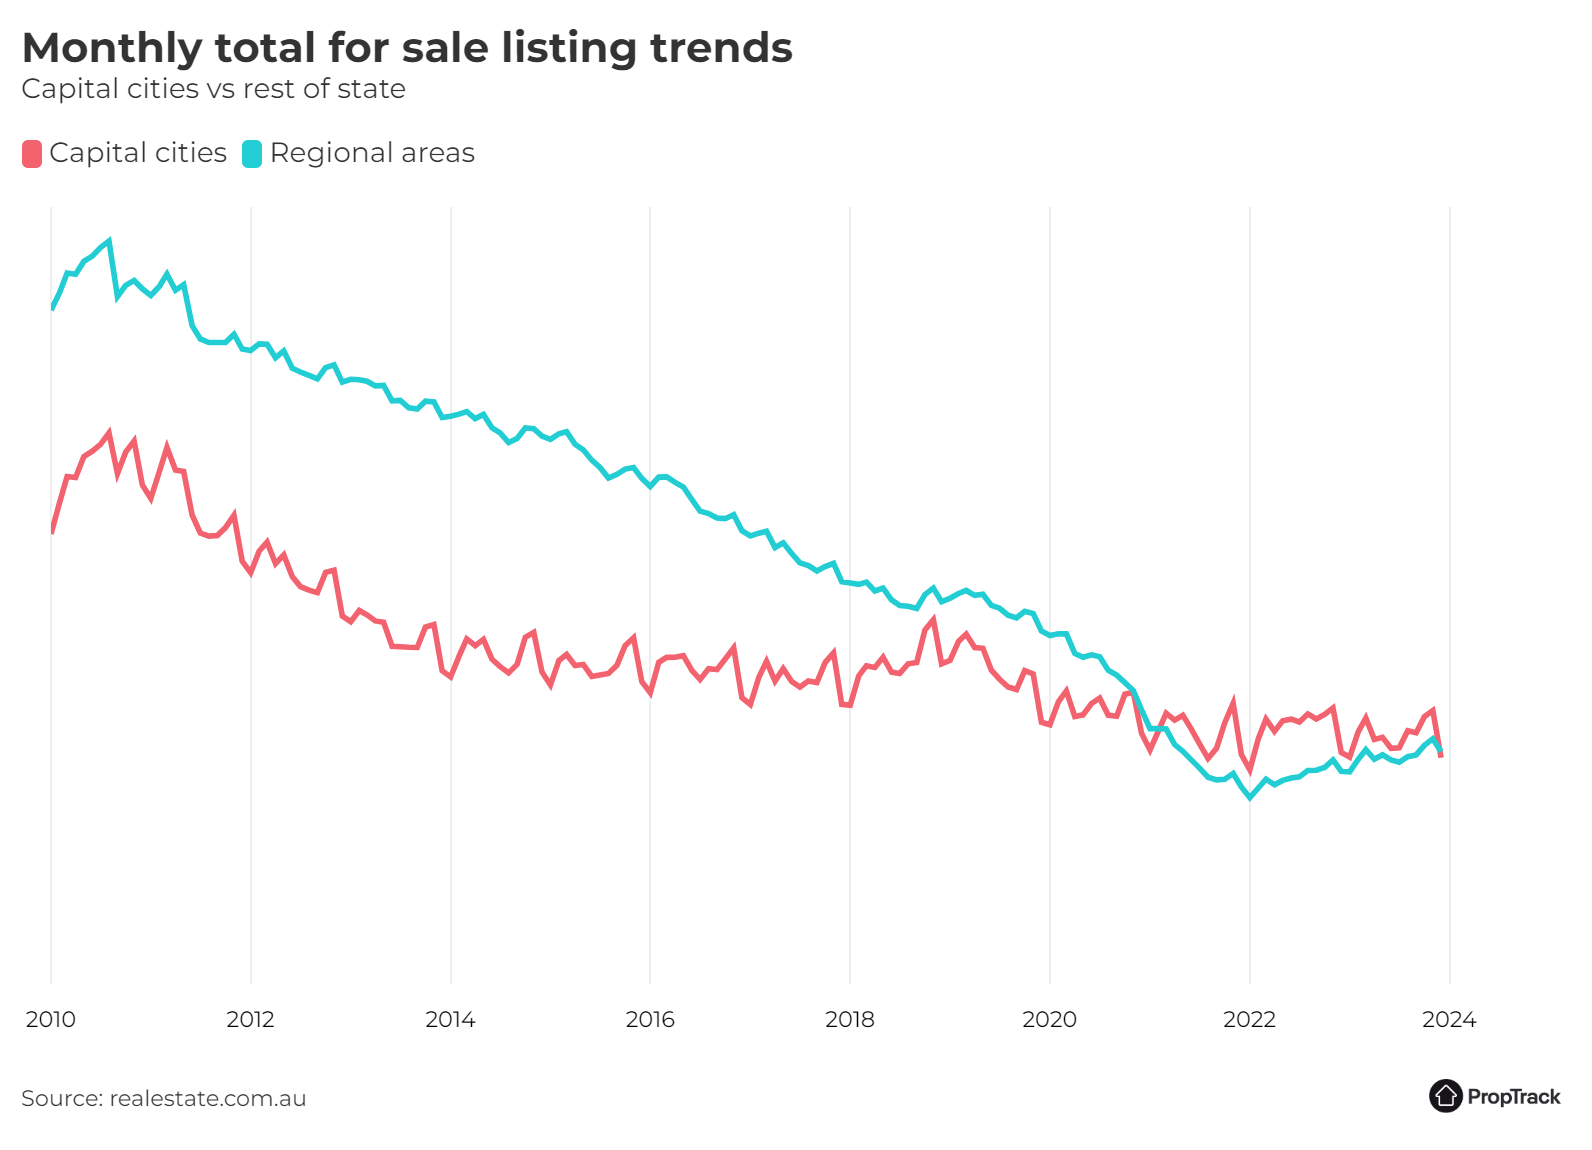
As has been the case for a while, the same is not true in other capitals, with quite limited choice for buyers and choice declining further in December. The total number of properties listed for sale in Brisbane, Adelaide and Perth fell to around 50-55% of what has been typical over the past decade, and Perth fell to its lowest on record.
Choice also fell regionally amid the end-of-year break, though the decline was not as sharp as in the capitals. The total number of properties listed for sale regionally remains higher than a year ago, up 9.3% year-on-year.
After the traditionally quiet end-of-year period, market activity is expected to pick back up in the second half of January, as it normally does once buyers and sellers return from holidays.
Sydney and Melbourne saw activity much closer to what has been typical in the past decade across spring 2023, after a very quiet spring in 2022. The increase in activity towards the end of 2023 was supported by improved selling conditions, more certainty about interest rates, and home prices returning to growth in 2023. In contrast, some of the other capitals – particularly Brisbane, Adelaide and Perth – have remained quieter.
After raising interest rates in November, the RBA held steady in December. Further interest rate increases remain a possibility if inflation proves more persistent than the RBA is expecting, which could have a negative impact on buyer and seller confidence and sentiment. However, markets are no longer expecting further increases.
The ‘PropTrack Listings Report’ details monthly changes in the number of properties listed for sale on realestate.com.au. The listings are split into ‘new’ and ‘total’ listings.
New listings consist of properties that were newly listed for sale on realestate.com.au within the reported month.
Total listings is the total supply of properties for sale in the reported month. It consists of all listings which were for sale during that month (including new listings) irrespective of the date they first appeared on site.
The geographical areas described in this report are based on the Greater Capital City Statistical Area (GCCSA) as defined by the Australian Bureau of Statistics.
Disclaimer: PropTrack Listings Report is summary information only. realestate.com.au Pty Limited [REA] makes no representation whatsoever about PropTrack Listings Report’s completeness or accuracy. REA is under no obligation to update or correct any of the PropTrack Listings Report data or to continue to make the PropTrack Listings Report available. REA recommends that any users of the PropTrack Listings Report exercise their own skill and care with respect to their use of the PropTrack Listings Report and that users carefully evaluate the accuracy, currency, completeness and relevance of the PropTrack Listings Report for their purposes. REA expressly bears no responsibility, and accepts no liability, whatsoever for any reliance placed by you or others on the PropTrack Listings Report, or from any use of the PropTrack Listings Report by you or others. If you wish to cite or refer to this report (or any findings or data contained in it) in any publication, please refer to the report as the ‘PropTrack Listings Report – December 2023′.